⚙️AP Physics C: Mechanics
3. A student wants to investigate one-dimensional motion using a motion detector and a cart on a horizontal track.
In Scenario 1, the student wants to determine the velocity vcart of the cart as measured in the reference frame of the stationary motion detector.
Describe an experimental procedure using the equipment available to collect data that would allow the student to determine vcart. Include specific measurements to be made and any steps necessary to reduce experimental uncertainty.
In Scenario 2, the motion detector moves at constant velocity v₀ = 0.40 m/s to the right while the cart moves at constant velocity vcart to the right. The distance d between the detector and the cart is recorded as a function of time t.
Describe how the student could use the relationship between d and t to determine the velocity of the cart as measured in the reference frame of the moving motion detector. Your response should include how to analyze data or a graph to determine this velocity.
Figure 1. Scenario 1 setup
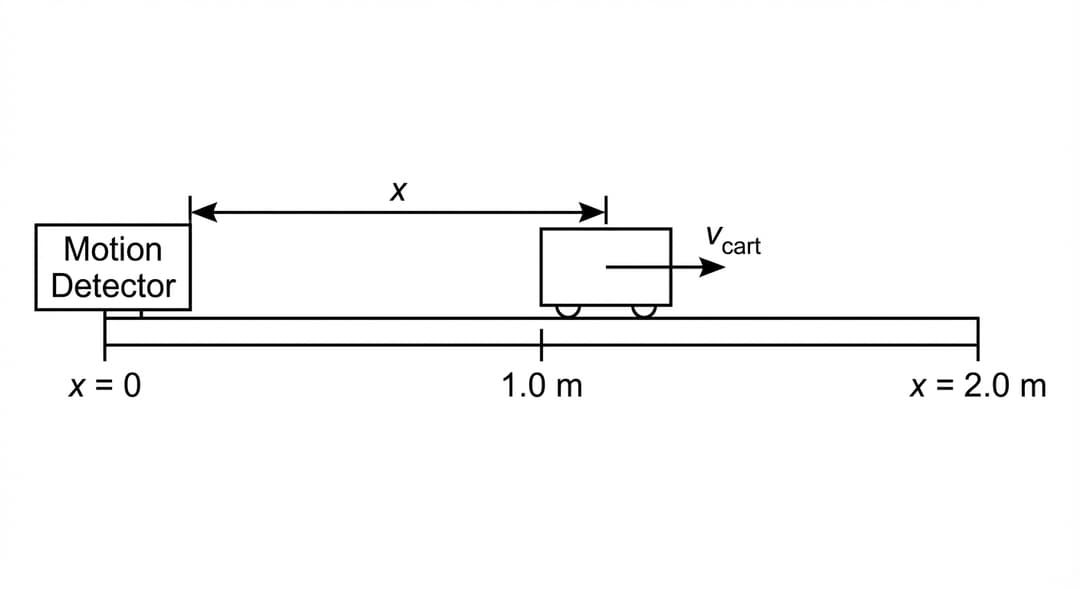
Figure 2. Scenario 2 setup
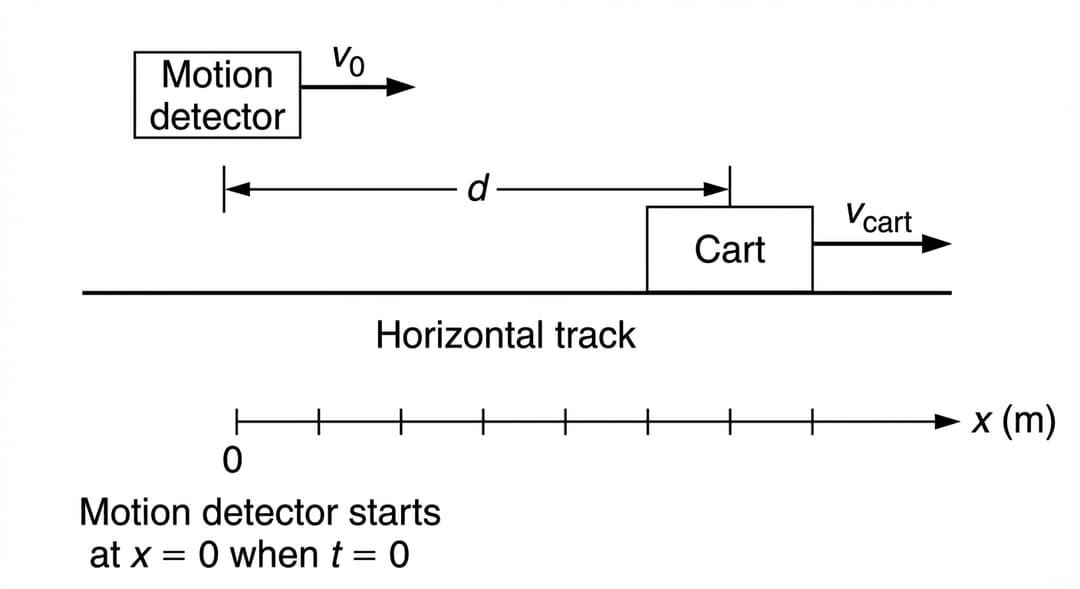
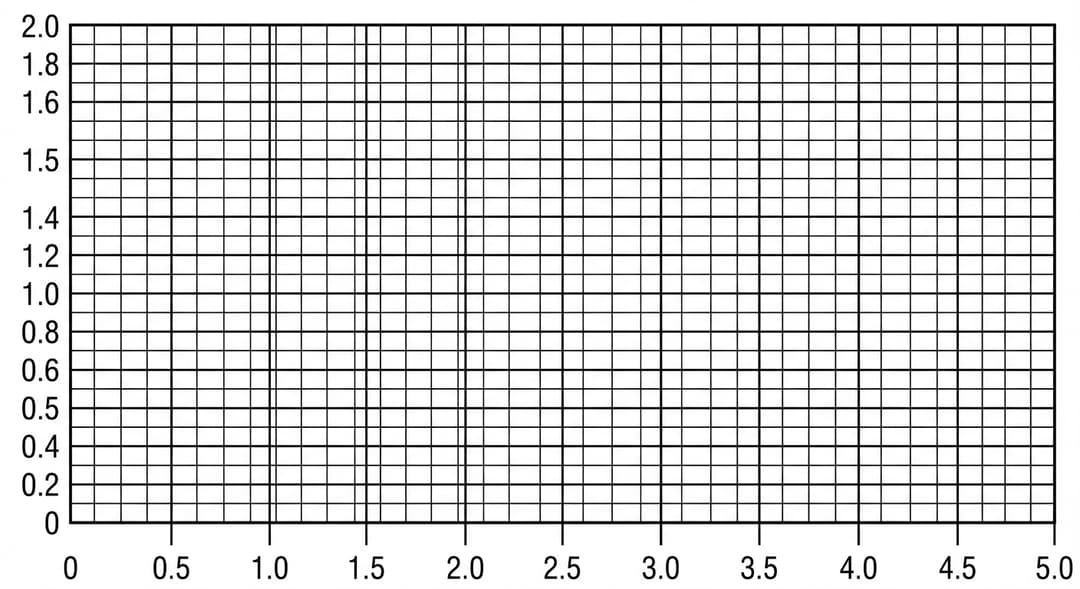
Figure 3. Grid for graphing
t (s) | d (m) |
|---|---|
0.0 | 0.20 |
1.0 | 0.50 |
2.0 | 0.80 |
3.0 | 1.10 |
4.0 | 1.40 |
The student performs the experiment described in Scenario 2. The motion detector starts at position x = 0 at time t = 0 and moves at constant velocity v₀ = 0.40 m/s to the right. The cart also moves to the right at constant velocity vcart. The motion detector records the distance d between itself and the cart at various times t, as shown in Table 1.
Indicate two quantities that could be graphed to produce a straight line whose slope could be used to determine the velocity of the cart as measured in the reference frame of the moving motion detector.
Vertical axis: Horizontal axis:
On the grid provided in Figure 3, create a graph of the quantities indicated in part C(i).
Use Table 2 to record any calculated quantities that you will plot.
Clearly label the axes, including units as appropriate.
Plot the points you recorded in Table 2 or from Table 1.
Draw a best-fit line to the data graphed in part C(ii).
Using the best-fit line that you drew in part C(iii), calculate the velocity of the cart as measured in the reference frame of the moving motion detector.