⚙️AP Physics C: Mechanics
2. A student stands on the ground floor of a building and throws a ball upward at an angle from a height of 2.0 m above the ground. The ball is thrown with an initial speed of 15 m/s at an angle of 53° above the horizontal, as shown in Figure 1. The ball reaches a maximum height and then falls to the ground. Air resistance is negligible.
Figure 1. Ball launched from height 2.0 m with initial speed 15 m/s at 53°; elevator in adjacent building moves downward at 3.0 m/s.
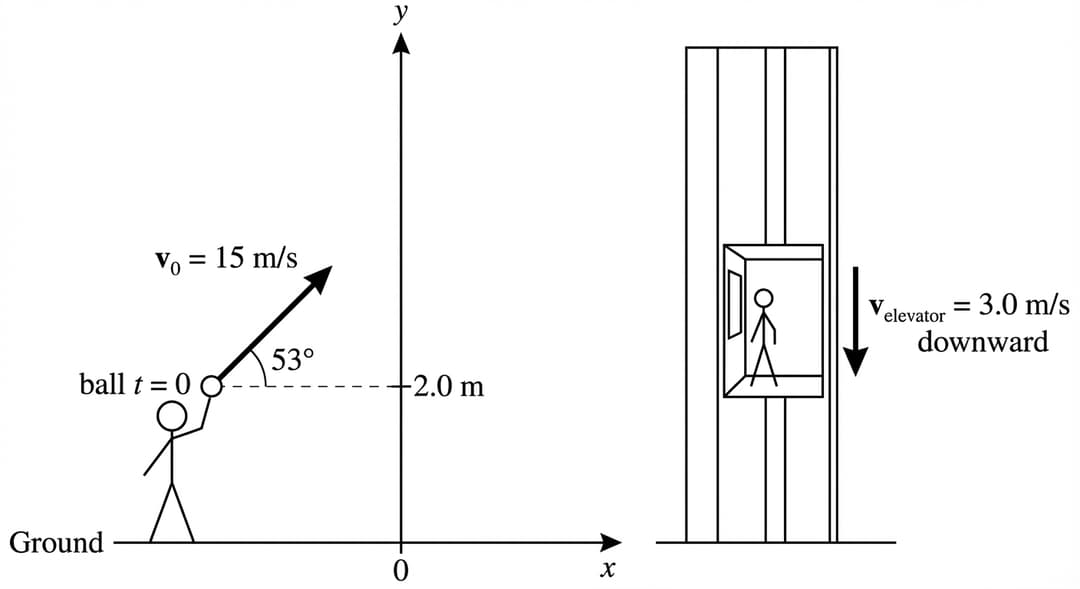
Figure 2. Axes for drawing the initial velocity vector and its components.
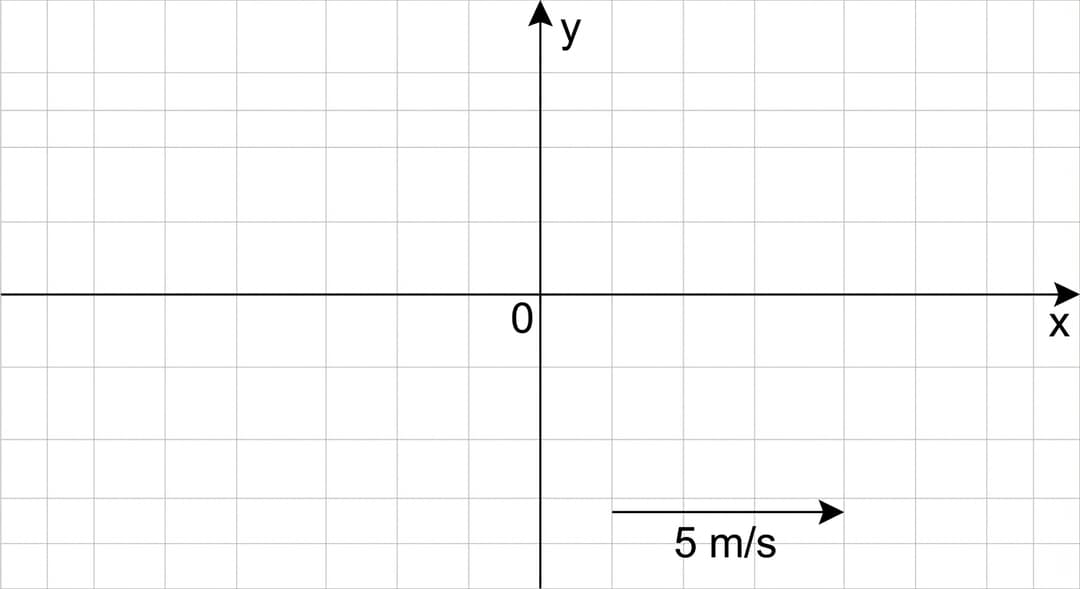
On the coordinate axes in Figure 2, draw a vector to represent the initial velocity of the ball as observed by the student on the ground. The length of the vector should be proportional to the magnitude of the velocity. On the same axes, draw the horizontal and vertical components of the initial velocity vector. Label each component with its magnitude.
Derive an expression for the vertical component of the ball's velocity as measured by the person in the elevator at time after the ball is thrown. Express your answer in terms of the given quantities (initial speed m/s, angle , elevator speed m/s), , , and physical constants, as appropriate. Begin your derivation by writing a fundamental physics principle or an equation from the reference information. The person in the elevator observes the ball's motion from the elevator reference frame.
Figure 3. Axes for v_y of the ball vs time as measured by the student on the ground.
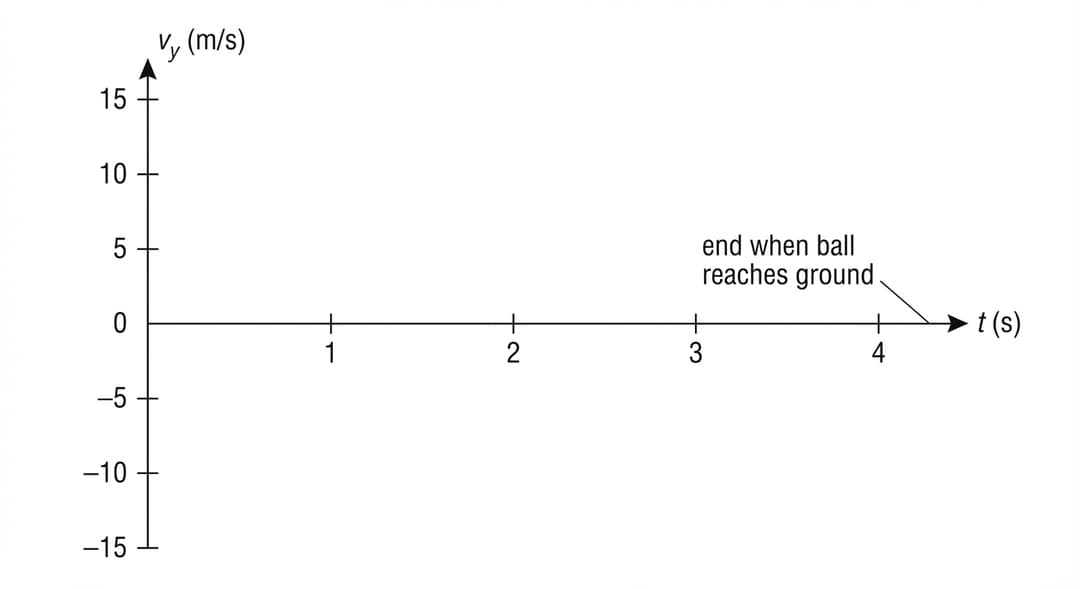
On the axes in Figure 3, sketch a graph of the vertical component of velocity of the ball as a function of time as measured by the student on the ground. The graph should begin at when the ball is thrown and end when the ball reaches the ground. Clearly indicate the initial value of and any intercepts with numerical values or expressions. Consider the motion of the ball as observed by the student on the ground.
Figure 4. Axes for v_y of the ball vs time as measured by a person in the descending elevator.
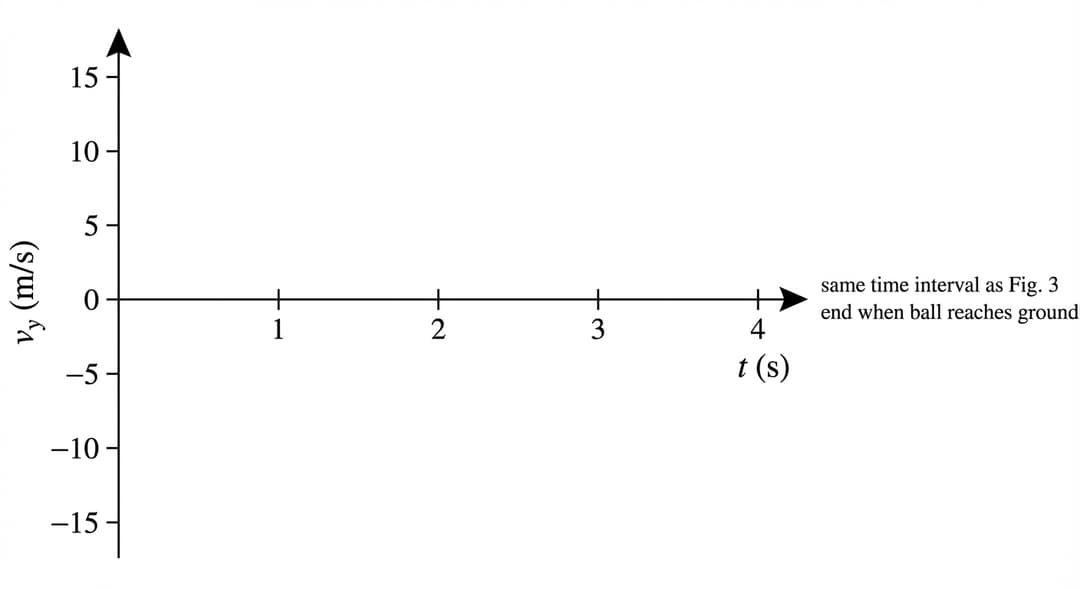
On the axes in Figure 4, sketch a graph of the vertical component of velocity of the ball as a function of time as measured by the person in the elevator. Use the same time interval as in Part C. Now consider the motion of the ball as observed by the person in the elevator moving downward at constant velocity m/s.
Describe one specific quantitative feature of the graph in Figure 4 that differs from the graph in Figure 3. State explicitly what the feature is and whether it increases or decreases compared to Figure 3.
Briefly justify your answer using physics principles.