💡AP Physics C: E&M
3. In Experiment 1, students are asked to determine the permittivity of an unknown, uniform dielectric sheet by measuring how the electric field between two large, parallel conducting plates changes when the dielectric is inserted. The plates are mounted horizontally and separated by a distance using insulating spacers. The students can charge the top plate and bottom plate so that the charges on the plates have equal magnitude and opposite sign. They have access to an electrometer (to measure charge), a high-voltage power supply, a voltmeter, a meterstick, and an electronic balance. The region between the plates is initially air (take ).
Figure 1. Parallel-plate capacitor apparatus for measuring dielectric permittivity with fixed plate separation d = 6.0 mm.
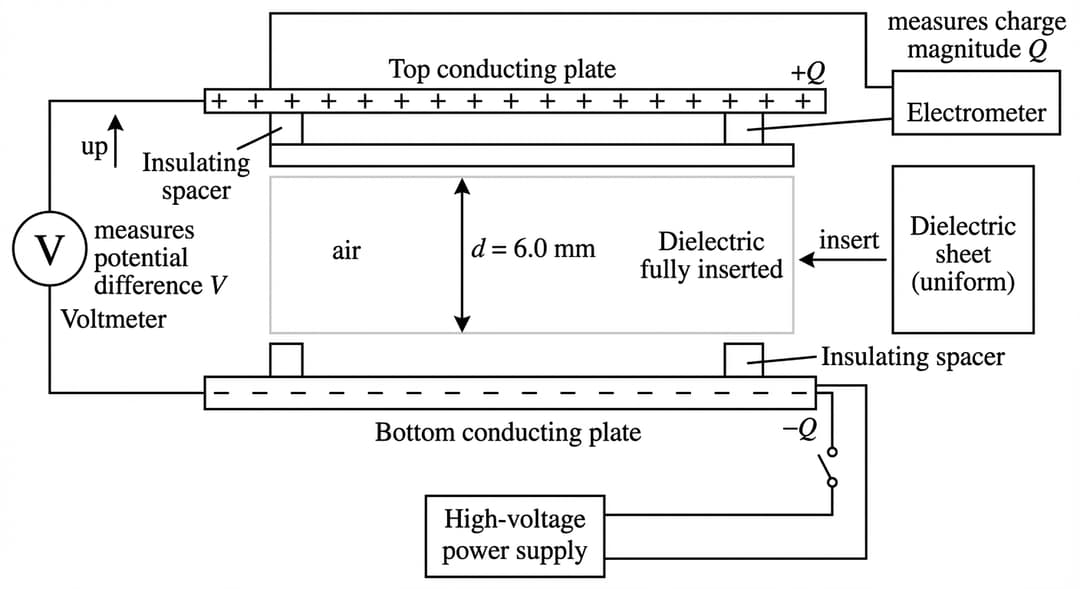
Figure 2. Blank Cartesian grid for student graph (axes labeled; no data plotted).
Describe a procedure for collecting data that would allow the students to use a graph to determine of the dielectric sheet, including any steps necessary to reduce experimental uncertainty.
Describe how the collected data could be graphed and how that graph would be analyzed to determine . Include how the electric field between the plates is related to measured quantities and how Gauss’s law applies.
Q (nC) | V_air (V) | V_dielectric (V) |
|---|---|---|
10.0 | 34 | 15 |
20.0 | 69 | 31 |
30.0 | 106 | 48 |
40.0 | 137 | 62 |
50.0 | 173 | 77 |
In Experiment 2, the students use the same plate separation and the same pair of plates. They collect data for several values of the measured plate charge magnitude . For each value of , they measure the potential difference with air between the plates, , and then they fully insert the unknown dielectric sheet and measure the potential difference again, , while keeping unchanged. The data are shown in Table 1.
Indicate two quantities, either measured quantities from Table 1 or additional calculated quantities, that could be graphed to produce a straight line that could be used to determine .
Vertical axis: Horizontal axis:
On the grid provided, create a graph of the quantities indicated in part C(i).
Use Table 2 to record the measured or calculated quantities that you will plot.
Clearly label the axes, including units as appropriate.
Plot the points you recorded in Table 2.
Draw a best-fit line for the data graphed in part C(ii).
Using the best-fit line that you drew in part C(iii), calculate an experimental value for the permittivity of the dielectric sheet. Assume the plates are large enough that fringing is negligible, so the field between the plates is uniform. The plate separation is . The plate area is . Use . Use your best-fit line from part C(iii) to determine the slope needed for the calculation.