🚜AP Human Geography
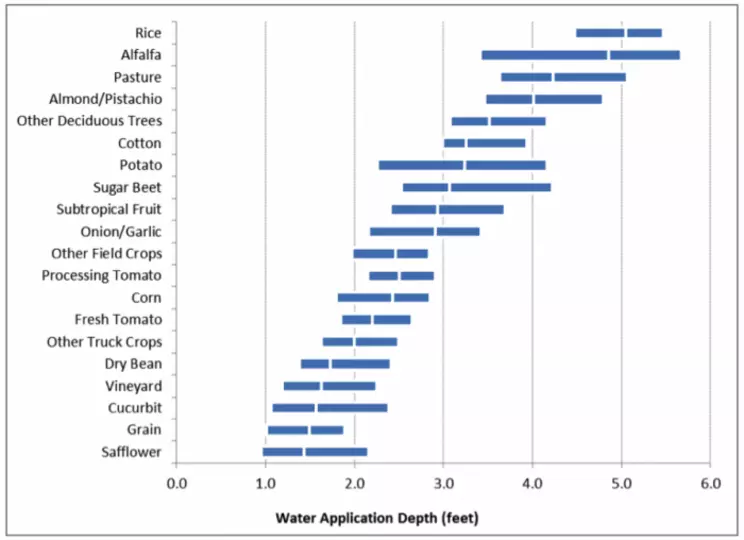
Water use by Crop
2. Respond to parts A, B, C, D, E, F, and G.
Identify ONE crop shown in the chart that requires a maximum water application depth of more than 5.0 feet.
Describe the difference in water application depth between Almond/Pistachio crops and Vineyard crops shown in the chart.
Describe ONE method of geographic data collection a researcher could use to gather the water usage data shown in the chart.
Explain ONE way a government agency could use a geographic information system (GIS) to manage water resources for the crops shown in the chart.
Explain how the cultivation of high-water-use crops, such as rice or alfalfa, in arid regions illustrates the concept of environmental possibilism.
Explain what a local scale of analysis might reveal about agricultural water use that a national scale of analysis would obscure.
Explain a limitation of using the crop water application data shown in the chart to define a formal agricultural region.