Fiveable
♻️AP Environmental Science
​

♻️AP Environmental Science

FRQ 1 – Experimental Design
​
Unit 1: The Living World: Ecosystems
​
FRQ Types & Units

Each FRQ type tests specific skills taught in particular units. Here's why certain units appear for each question type:

This mapping reflects College Board's exam structure - each FRQ type tests specific skills that are taught in particular units.

Practice FRQ 1 of 221/22

1. A temperate deciduous forest ecosystem in the northeastern United States experiences distinct seasonal changes. During autumn, trees shed their leaves, creating a layer of leaf litter on the forest floor. Decomposers such as fungi and bacteria break down this organic matter, releasing nutrients back into the soil. Scientists studied the relationship between temperature and decomposition rates, as well as the flow of energy through different trophic levels in this ecosystem.

A.

Describe one way that primary producers in a temperate deciduous forest acquire and convert solar energy.

B.

Based on the information provided, explain how decomposers contribute to the availability of nitrogen for primary producers in the forest ecosystem.

Figure 1. Standing Biomass by Trophic Level in a Temperate Deciduous Forest (kg/m²)

Vertical bar graph with four bars.

Axes (must be drawn exactly as specified):
- X-axis label centered below axis: "Trophic level".
- X-axis has four category tick marks evenly spaced left-to-right, each tick centered under one bar. The category labels printed directly under the ticks, in this exact left-to-right order: "Primary Producers", "Primary Consumers", "Secondary Consumers", "Tertiary Consumers".
- Y-axis label rotated vertically along the left side: "Biomass (kg/m²)".
- Y-axis numeric range starts at 0 and ends at 25.
- Y-axis tick marks and printed tick labels at an interval of 5 units only: 0, 5, 10, 15, 20, 25.
- The origin is shown and labeled with the tick value "0" at the intersection of the axes.
- No arrows on the ends of the axes.
- No gridlines.

Bar specifications (identical styling for all bars):
- Exactly four vertical rectangular bars, one per category tick.
- All bars have uniform width equal to 60% of the distance between adjacent category ticks (so each bar leaves equal left and right gaps to the next bar).
- Fill color: solid medium-gray.
- Outline: solid black outline with a clearly visible medium stroke.

Bar heights and error bars (must be numerically exact):
- Bar at "Primary Producers": bar top aligns exactly with 22 on the y-axis. Error bar is centered on the bar and extends from 20 to 24 on the y-axis (±2). Error bar line is black. Error bar caps are horizontal, with cap width equal to 40% of the bar width.
- Bar at "Primary Consumers": bar top aligns exactly with 2.8 on the y-axis (well below the 5 tick). Error bar extends from 2.5 to 3.1 on the y-axis (±0.3). Caps same style and cap width as above.
- Bar at "Secondary Consumers": bar top aligns exactly with 0.35 on the y-axis (just above 0). Error bar extends from 0.30 to 0.40 on the y-axis (±0.05). Caps same style and cap width as above.
- Bar at "Tertiary Consumers": bar top aligns exactly with 0.04 on the y-axis (very close to 0, but clearly above the baseline). Error bar extends from 0.03 to 0.05 on the y-axis (±0.01). Caps same style and cap width as above.

Layout constraints to prevent mis-rendering:
- The baseline of every bar sits exactly on the y=0 axis line (no floating bars).
- Error bars must be visible for all four categories and must extend above and below the bar mean (not only above).

No additional text inside the plotting area besides the axis tick labels and axis titles.
C.

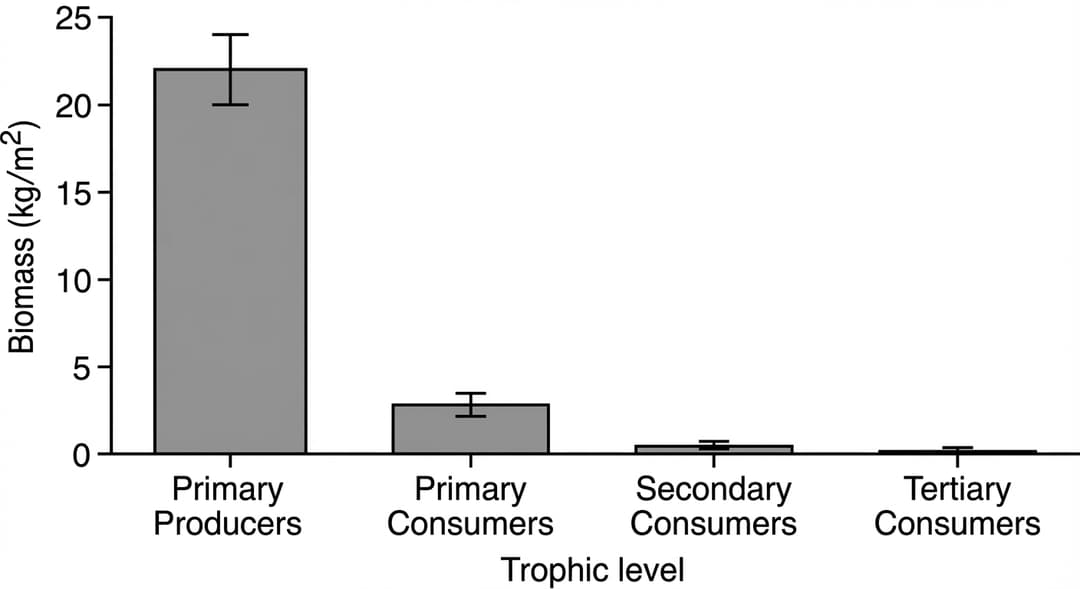
Based on the data in Figure 1, identify the biomass of secondary consumers in kg/m².

Figure 2. Temperature and Rate of Leaf Litter Decomposition (% mass loss per month)

Single-panel line graph showing decomposition rate as a function of temperature.

Axes (must be drawn exactly as specified):
- X-axis label centered below axis: "Temperature (°C)".
- X-axis numeric range starts at 0 and ends at 35.
- X-axis tick marks and printed tick labels at an interval of 5 degrees only: 0, 5, 10, 15, 20, 25, 30, 35.
- Y-axis label rotated vertically along the left side: "Decomposition rate (% mass loss per month)".
- Y-axis numeric range starts at 0 and ends at 40.
- Y-axis tick marks and printed tick labels at an interval of 10 units only: 0, 10, 20, 30, 40.
- The origin is shown and labeled "0" at the intersection of the axes.
- Arrows on the positive ends of both axes.
- No gridlines.

Data markers and line style (to force exact values):
- Plot exactly eight filled circular markers (solid black circles) at each measured temperature tick except none between ticks.
- Each marker diameter is visually consistent and small (clearly visible but not large), and every marker sits exactly on its stated y-value.
- Connect the markers with a single continuous solid black line of medium thickness.

Exact data values (markers must align to these):
- At 0 °C, the marker is at 2%.
- At 5 °C, the marker is at 8%.
- At 10 °C, the marker is at 15%.
- At 15 °C, the marker is at 22%.
- At 20 °C, the marker is at 28%.
- At 25 °C, the marker is at 33%.
- At 30 °C, the marker is at 36%.
- At 35 °C, the marker is at 36% (same height as the 30 °C marker).

Curve/segment behavior (must match exactly):
- From 0 °C through 30 °C, the connected line increases monotonically (never decreases). The slope is positive throughout but steadily decreases as temperature rises, producing an overall concave-down shape across this increasing portion (steepest rise at the cold end, progressively flatter toward 30 °C).
- From 30 °C to 35 °C, the line segment is perfectly horizontal at 36%, indicating a plateau with zero slope over that final interval.
- The plotted line ends exactly at the 35 °C marker; do not extend the curve beyond the right boundary.

No legend and no additional annotation text inside the plot area.
D.

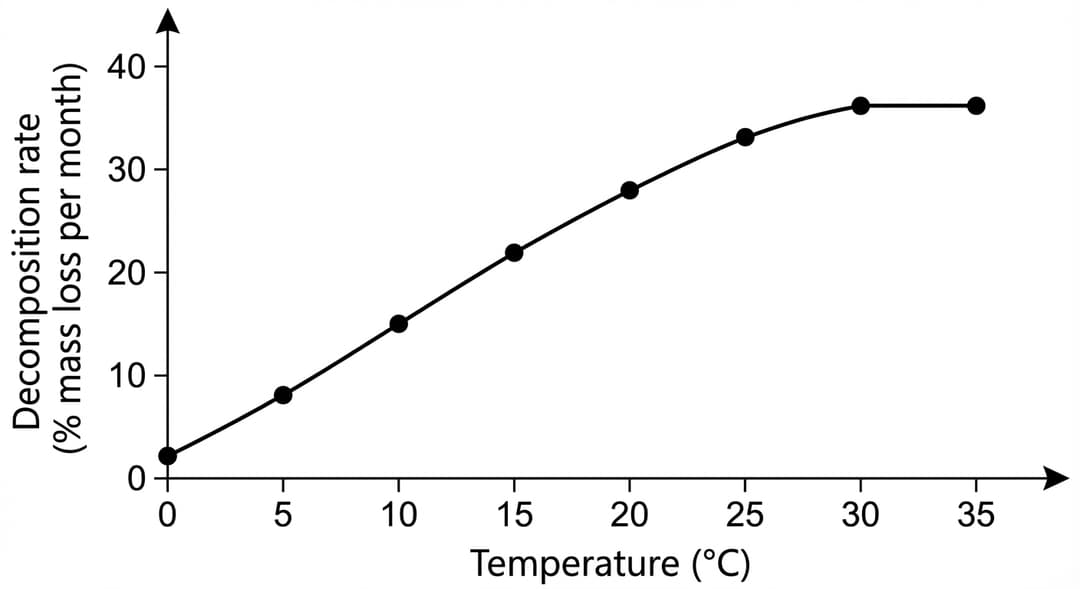
Based on the data in Figure 2, describe the relationship between temperature and the rate of leaf litter decomposition.

E.

Scientists hypothesized that approximately 10% of energy is transferred from primary producers to primary consumers. Describe how the data in Figure 1 could be used to evaluate this hypothesis.

F.

Decomposition rates affect nutrient cycling in forest ecosystems. A group of students wanted to investigate factors that influence decomposition. They collected fresh leaf litter from oak trees and placed equal masses (50 grams) of leaves into mesh bags. They buried 15 bags in an undisturbed forest area and 15 bags in a recently logged area. After 6 months, students retrieved the bags, dried the remaining leaf material, and measured the mass loss to determine decomposition rate.

i.

Identify the independent variable in the students' investigation.

ii.

Identify one environmental variable that should be held constant between the two sites to ensure a valid comparison.

Site

Species A (Millipede)

Species B (Earthworm)

Species C (Beetle)

Species D (Springtail)

Species E (Centipede)

Species F (Mite)

Undisturbed forest

X

X

X

X

X

X

Logged area

X

X

G.

The students also investigated soil invertebrate diversity at both sites. The data from their investigation are shown in the table. An 'X' indicates that the species was present at that site.

i.

Explain why higher biodiversity of decomposer organisms in the undisturbed forest would lead to more efficient nutrient cycling compared to the logged area.

ii.

Explain one reason why species richness differs between the undisturbed forest and the logged area.

H.

Describe one effect that increased temperatures could have on the carbon cycle in this forest ecosystem, based on the relationship shown in Figure 2. Climate change is causing average temperatures to increase in temperate deciduous forests.


Pep

essential ap study content awaits..

Features
Testimonials
Testimonials
start studying →
FRQ Directions
Free Response Question Practice

This practice environment simulates the AP AP Environmental Science Free Response Questions section. Here are some guidelines:

  • Read each question carefullybefore responding. Pay attention to command verbs like "identify," "explain," "analyze," or "evaluate."
  • Use the timer to practice time management. You can pause, restart, or hide the timer as needed.
  • Mark for Review if you want to come back to a question later.
  • Your responses are saved automatically as you type. You can also use the drawing tool for questions that require diagrams or graphs.
  • Use the toolbar for formatting options like bold, italic, subscript, and superscript.
  • Navigate between questions using the Previous and Next buttons at the bottom of the screen.

Tip: Answer all parts of each question. Partial credit is often available, so even if you are unsure, provide what you know.