Sampling distributions are a key concept in statistics, bridging the gap between parameters and statistics. They describe how sample statistics vary across multiple samples, enabling statisticians to make inferences about populations based on limited data.

Understanding sampling distributions is crucial for selecting appropriate statistical methods and interpreting results. This topic covers various types of sampling distributions, their properties, and applications in hypothesis testing and regression analysis, providing a foundation for statistical inference.

Definition of sampling distributions

  • Sampling distributions form a crucial concept in theoretical statistics, bridging the gap between population parameters and sample statistics
  • Understanding sampling distributions enables statisticians to make inferences about populations based on limited sample data
  • These distributions describe the variability of sample statistics across multiple samples drawn from the same population

Population vs sample

Top images from around the web for Population vs sample
  • Population encompasses all possible observations or measurements of interest in a study
  • Sample represents a subset of the population, typically used to estimate population characteristics
  • Relationship between population and sample illustrated through the sampling process (random selection, stratification)
  • Importance of representative samples in making valid statistical inferences about the population

Parameters vs statistics

  • Parameters defined as numerical characteristics of the entire population (μ for mean, σ for )
  • Statistics calculated from sample data to estimate corresponding population parameters (xˉ\bar{x} for sample mean, s for sample standard deviation)
  • causes statistics to differ from sample to sample
  • Sampling distributions describe the behavior of these sample statistics across repeated sampling

Types of sampling distributions

  • Sampling distributions vary depending on the of interest and the underlying population distribution
  • Understanding different types of sampling distributions aids in selecting appropriate statistical methods for analysis
  • Common sampling distributions include those for means, proportions, and variances

Distribution of sample mean

  • Describes the behavior of sample means across repeated sampling from a population
  • Shape influenced by the underlying population distribution and
  • applies for large sample sizes, resulting in approximately
  • of the mean given by SExˉ=σnSE_{\bar{x}} = \frac{\sigma}{\sqrt{n}}
  • Applications in constructing confidence intervals and hypothesis tests for population means

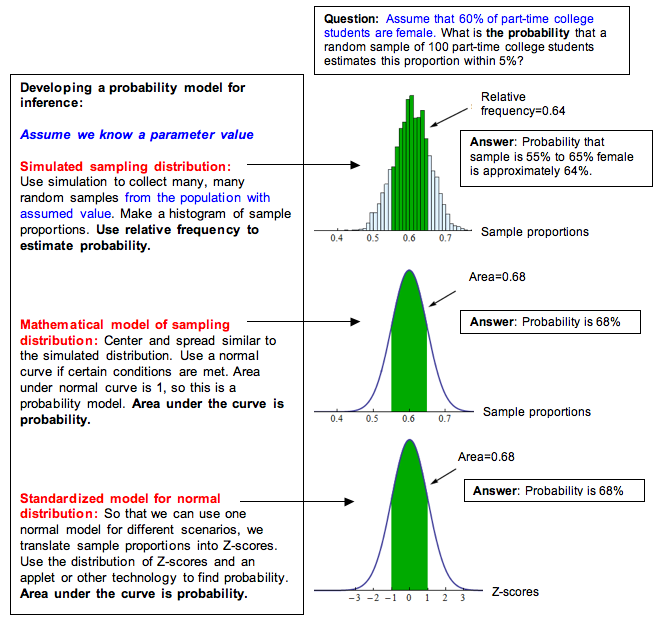
Distribution of sample proportion

  • Characterizes the variability of sample proportions in repeated sampling from a population
  • Approximated by normal distribution when sample size is large and population proportion is not extreme
  • Standard error of the proportion calculated as SEp=p(1p)nSE_p = \sqrt{\frac{p(1-p)}{n}}
  • Used in analyzing categorical data and estimating population proportions

Distribution of sample variance

  • Describes the behavior of sample variances across repeated sampling
  • Follows a chi-square distribution when the population is normally distributed
  • Degrees of freedom equal to n-1, where n is the sample size
  • Applications in hypothesis testing for population variances and constructing confidence intervals

Properties of sampling distributions

  • Understanding the properties of sampling distributions enables statisticians to make accurate inferences about population parameters
  • These properties form the foundation for many statistical techniques used in data analysis and hypothesis testing
  • Key properties include expected value, standard error, and shape characteristics

Expected value

  • Expected value of a equals the corresponding population
  • Unbiasedness of estimators demonstrated when E(statistic) = parameter
  • For sample mean: E(xˉ\bar{x}) = μ
  • For sample proportion: E(p) = π (population proportion)
  • Importance in assessing the quality of estimators and their long-run behavior

Standard error

  • Measures the variability or precision of a sampling distribution
  • Calculated as the standard deviation of the sampling distribution
  • Decreases as sample size increases, indicating improved precision
  • Used in constructing confidence intervals and conducting hypothesis tests
  • Relationship with margin of error in survey sampling and polling

Shape and symmetry

  • Shape of sampling distribution influenced by underlying population distribution and sample size
  • Tendency towards normality for large sample sizes (Central Limit Theorem)
  • Symmetry properties affect the applicability of certain statistical methods
  • Skewness and kurtosis measures used to describe deviations from normality
  • Impact on the choice of parametric vs non-parametric statistical techniques

Central Limit Theorem

  • Fundamental theorem in probability theory and statistics
  • States that the sampling distribution of the mean approaches a normal distribution as sample size increases
  • Applies regardless of the shape of the underlying population distribution
  • Enables the use of normal distribution-based methods for large sample sizes

Conditions for CLT

  • Independent and identically distributed (i.i.d.) random variables
  • Finite population variance
  • Sufficiently large sample size (generally n ≥ 30)
  • Relaxation of normality assumption for underlying population
  • Robustness to slight violations of assumptions in practice

Applications of CLT

  • Justification for using normal distribution in many statistical analyses
  • Construction of confidence intervals for population means
  • Hypothesis testing for population parameters
  • Quality control in manufacturing processes
  • Risk assessment in finance and insurance

Standard error vs standard deviation

  • Both measures of variability, but applied to different contexts
  • Standard deviation describes variability in individual observations
  • Standard error quantifies variability in sampling distributions of statistics
  • Understanding the distinction crucial for proper interpretation of statistical results

Relationship between SE and SD

  • Standard error typically smaller than standard deviation
  • SE decreases as sample size increases, while SD remains constant
  • For sample mean: SExˉ=SDnSE_{\bar{x}} = \frac{SD}{\sqrt{n}}
  • Implications for precision of estimates and power of statistical tests
  • Trade-off between sample size and precision in study design

Factors affecting SE

  • Sample size: Larger samples lead to smaller standard errors
  • Population variability: Greater population SD results in larger SE
  • Sampling method: Complex sampling designs may increase SE
  • Non-response and measurement error in surveys
  • Stratification and clustering effects in complex sampling designs

Sampling distribution of differences

  • Describes the behavior of differences between two sample statistics
  • Important in comparative studies and hypothesis testing involving two groups
  • Assumptions of independence between samples and normality of underlying distributions

Difference between two means

  • Sampling distribution of xˉ1xˉ2\bar{x}_1 - \bar{x}_2 follows normal distribution for large samples
  • Standard error calculated as SExˉ1xˉ2=s12n1+s22n2SE_{\bar{x}_1 - \bar{x}_2} = \sqrt{\frac{s_1^2}{n_1} + \frac{s_2^2}{n_2}}
  • Applications in two-sample t-tests and confidence intervals for mean differences
  • Pooled vs unpooled standard error depending on equal variance assumption

Difference between two proportions

  • Sampling distribution of p1p2p_1 - p_2 approximately normal for large samples
  • Standard error given by SEp1p2=p1(1p1)n1+p2(1p2)n2SE_{p_1 - p_2} = \sqrt{\frac{p_1(1-p_1)}{n_1} + \frac{p_2(1-p_2)}{n_2}}
  • Used in hypothesis testing for equality of proportions
  • Applications in comparing treatment effects in clinical trials
  • Considerations for small samples and extreme proportions

Sampling techniques

  • Various methods used to select samples from a population
  • Choice of technique affects the representativeness and precision of estimates
  • Trade-offs between simplicity, cost, and statistical efficiency

Simple random sampling

  • Each unit in the population has an equal probability of selection
  • Unbiased method for selecting a representative sample
  • Implemented using random number generators or systematic selection
  • Advantages include simplicity and well-established statistical theory
  • Limitations in practice due to lack of complete sampling frames

Stratified sampling

  • Population divided into homogeneous subgroups (strata) before sampling
  • Samples drawn independently from each stratum
  • Improves precision for given sample size compared to
  • Ensures representation of important subgroups in the sample
  • Applications in survey research and population studies

Cluster sampling

  • Population divided into clusters, typically based on geographic areas
  • Clusters randomly selected, then all units within selected clusters sampled
  • Cost-effective for geographically dispersed populations
  • Reduces travel and administrative costs in field surveys
  • Generally less precise than simple random sampling due to intra-cluster correlation

Sample size considerations

  • Determining appropriate sample size crucial for balancing statistical power and resource constraints
  • Impacts the precision of estimates and the ability to detect significant effects
  • Involves trade-offs between desired level of accuracy and practical limitations

Effect on sampling distribution

  • Larger sample sizes lead to narrower sampling distributions
  • Improved precision of estimates with increasing sample size
  • Reduction in standard error proportional to square root of sample size
  • Diminishing returns in precision as sample size becomes very large
  • Impact on statistical power and ability to detect smaller effect sizes

Precision vs cost trade-offs

  • Increasing sample size improves precision but raises costs
  • Optimal sample size depends on budget constraints and desired level of accuracy
  • Consideration of marginal benefits of additional samples
  • Strategies for allocating resources in multi-stage or designs
  • Use of power analysis and effect size considerations in sample size determination

Bootstrapping

  • Resampling technique used to estimate sampling distributions empirically
  • Particularly useful when theoretical distributions are unknown or assumptions are violated
  • Enables inference about population parameters without relying on parametric assumptions

Concept and methodology

  • Repeatedly drawing samples with replacement from the original sample
  • Calculating the statistic of interest for each resampled dataset
  • Distribution of resampled statistics approximates the true sampling distribution
  • Number of bootstrap samples typically large (1000 to 10000)
  • Implementation using computer simulations and statistical software

Advantages and limitations

  • Non-parametric approach, applicable to a wide range of statistics
  • Provides estimates of standard errors and confidence intervals
  • Useful for complex estimators without known sampling distributions
  • Limitations in small samples or when original sample is not representative
  • Computational intensity and potential for in certain scenarios

Applications in hypothesis testing

  • Sampling distributions form the basis for many hypothesis testing procedures
  • Understanding sampling distributions crucial for interpreting test results and p-values
  • Applications in various fields including medicine, psychology, and economics

Test statistics

  • Functions of sample data used to make decisions about hypotheses
  • Common test statistics include t-statistic, z-score, and F-statistic
  • Sampling distributions of test statistics under null hypothesis known or approximated
  • Critical values determined from these sampling distributions
  • Relationship between test statistic, effect size, and sample size

P-value calculations

  • Probability of obtaining test statistic as extreme as observed, assuming null hypothesis true
  • Calculated using the sampling distribution of the test statistic under H0
  • Interpretation as strength of evidence against null hypothesis
  • Relationship between p-value, significance level, and rate
  • Controversies and limitations of p-value based inference

Sampling distribution in regression

  • Describes the behavior of regression coefficients across repeated sampling
  • Crucial for making inferences about population parameters in regression analysis
  • Assumptions of linearity, independence, homoscedasticity, and normality of errors

Distribution of regression coefficients

  • Sampling distribution of slope and intercept coefficients
  • Normality of coefficient distributions under classical linear regression assumptions
  • Standard errors of coefficients derived from the sampling distribution
  • Impact of violations of assumptions on the distribution of coefficients
  • Applications in testing significance of predictors and model comparisons

Confidence intervals for coefficients

  • Constructed using the sampling distribution of regression coefficients
  • Interpretation as plausible range for true population parameter
  • Calculation using point estimate ± (critical value × standard error)
  • Relationship between confidence level and interval width
  • Applications in assessing precision of estimated effects and prediction intervals

Key Terms to Review (34)

Bias: Bias refers to the systematic error that leads to an incorrect estimate of the population parameter due to a flaw in the data collection or analysis process. It can occur in various forms, influencing both theoretical predictions and practical applications, such as when estimators consistently overestimate or underestimate values. Understanding bias is crucial for accurate statistical inference and effective decision-making, particularly when evaluating expected values, analyzing sampling distributions, and developing point estimates.
Bootstrapping: Bootstrapping is a statistical method that involves resampling data with replacement to create multiple simulated samples, which helps estimate the distribution of a statistic. This technique allows for the approximation of sampling distributions and is especially useful when traditional methods are not feasible. It provides insights into the variability of a statistic and helps in constructing confidence intervals, making it an important tool in statistical inference.
Central Limit Theorem: The Central Limit Theorem states that the distribution of the sample means approaches a normal distribution as the sample size increases, regardless of the original population distribution, given that the samples are independent and identically distributed. This principle highlights the importance of sample size and how it affects the reliability of statistical inference.
Cluster Sampling: Cluster sampling is a statistical method where the population is divided into separate groups, known as clusters, and a random sample of these clusters is selected for analysis. This technique is especially useful when a population is too large or spread out to conduct a simple random sample. It connects to various aspects such as understanding how a sample represents a larger population, how sampling distributions are formed from these clusters, the implications of cluster size on sample size determination, and the specific method of executing cluster sampling effectively.
Consistency: Consistency refers to a property of an estimator where, as the sample size increases, the estimates produced converge in probability to the true value of the parameter being estimated. This concept is crucial in statistics because it ensures that with enough data, the estimators will yield results that are close to the actual parameter value, providing reliability in statistical inference.
Difference between two means: The difference between two means refers to the comparison of the average values of two distinct groups, often to assess whether there is a significant difference in their characteristics. This concept is crucial for hypothesis testing and is commonly applied in various fields, such as social sciences and medicine, to evaluate the effects of treatments or interventions. Understanding this difference helps researchers determine if observed variations are statistically significant or likely due to random chance.
Difference between two proportions: The difference between two proportions is a statistical concept that compares the proportion of a certain characteristic in two different groups. This term is crucial in hypothesis testing, particularly when assessing whether there is a significant difference between the two groups based on sample data. Understanding this concept helps in analyzing categorical data and making inferences about population parameters from sample statistics.
Distribution of Sample Mean: The distribution of sample mean refers to the probability distribution of all possible sample means that can be obtained from a given population. This concept is vital as it highlights how sample means tend to cluster around the population mean, especially as sample size increases, which is foundational in understanding how sampling distributions work and their relation to common probability distributions.
Distribution of Sample Proportion: The distribution of sample proportion refers to the probability distribution that describes the behavior of the sample proportion, which is the ratio of the number of successes in a sample to the total number of observations in that sample. This distribution plays a critical role in understanding sampling variability, as it allows statisticians to make inferences about a population based on sample data. It is especially useful when applying the Central Limit Theorem, which states that as sample size increases, the distribution of sample proportions will tend to approach a normal distribution, regardless of the shape of the population distribution.
Distribution of Sample Variance: The distribution of sample variance refers to the probability distribution that describes the variability of sample variance estimates calculated from random samples drawn from a population. This concept is crucial for understanding how the sample variance behaves as a statistic, especially when making inferences about the population variance based on sample data. It is closely linked to both common probability distributions and sampling distributions, as it provides insight into the dispersion of variances across different samples.
Interval Estimation: Interval estimation is a statistical method used to estimate a range of values, known as an interval, that is likely to contain the true value of a population parameter. This approach helps in quantifying uncertainty and provides a more informative estimate than point estimation, allowing researchers to understand the variability and reliability of their estimates based on sample data.
Law of Large Numbers: The Law of Large Numbers is a fundamental statistical principle that states as the size of a sample increases, the sample mean will converge to the population mean. This concept assures that larger samples provide more accurate estimates of population parameters, reinforcing the importance of large sample sizes in statistical analyses.
Maximum Likelihood Estimator: A maximum likelihood estimator (MLE) is a statistical method used to estimate the parameters of a probability distribution by maximizing the likelihood function, which measures how well a particular set of parameters explains the observed data. MLE is crucial for understanding sampling distributions, as it provides a way to derive estimates from sample data. This approach also ties into point estimation, as it offers a method for obtaining a single best estimate of an unknown parameter based on observed data, while its relationship with the Cramer-Rao lower bound establishes its efficiency in estimation. Additionally, discussions of admissibility and completeness often address whether MLEs are optimal under certain conditions, enhancing the understanding of their properties in decision theory and estimation theory.
Mean of the sampling distribution: The mean of the sampling distribution is the average value of all possible sample means that can be drawn from a population. This concept is crucial because it reflects the central tendency of the sample means and is equal to the population mean, showcasing that sampling doesn't skew results if done correctly. Understanding this mean helps in making inferences about the population based on sample data, as it lays the groundwork for concepts like the Central Limit Theorem and how sampling distributions behave.
Normal Distribution: Normal distribution is a continuous probability distribution characterized by its bell-shaped curve, symmetric about the mean. It is significant in statistics because many phenomena, such as heights and test scores, tend to follow this distribution, making it essential for various statistical analyses and models.
Parameter: A parameter is a numerical characteristic or measure that describes a specific aspect of a population, such as its mean, variance, or proportion. Parameters are vital for understanding the overall behavior of the population and are often estimated using sample data in statistical analysis. They serve as fixed values that summarize the entire group being studied, making them crucial for inferential statistics.
Point estimation: Point estimation is the process of providing a single value, or 'point', as an estimate of an unknown population parameter. This method allows statisticians to summarize data effectively by using sample statistics, such as the sample mean or sample proportion, to infer about larger populations. It is crucial in making informed decisions based on limited data, while also connecting to the concepts of sampling and decision-making in statistical analysis.
Population: Population refers to the entire group of individuals or items that share a characteristic being studied, often serving as the foundation for statistical analysis. In statistics, understanding the population is crucial because it helps determine the scope of research and informs how samples are selected and analyzed. The population can vary widely based on context, ranging from all adults in a country to specific sets like all students in a university.
Sample: A sample is a subset of individuals or observations selected from a larger group, known as the population, to gather insights or make inferences about that population. The choice of a sample is crucial as it can significantly affect the results and conclusions drawn from a study. Understanding how samples relate to populations, their distributions, and various sampling methods is essential for accurate statistical analysis.
Sample Size: Sample size refers to the number of observations or data points included in a statistical sample. It plays a crucial role in determining the reliability and accuracy of statistical estimates and conclusions drawn from a study. A larger sample size generally leads to more precise estimates, while a smaller sample may result in greater variability and uncertainty in the results.
Sampling distribution: A sampling distribution is the probability distribution of a statistic obtained through a large number of samples drawn from a specific population. It provides insight into how sample statistics, such as the sample mean or proportion, behave and vary around the true population parameter. This concept is crucial in understanding the variability of estimates and plays a significant role in making inferences about populations based on sample data.
Sampling distribution of differences: The sampling distribution of differences refers to the probability distribution of the differences between the means of two independent samples. This concept is crucial for hypothesis testing and determining how likely it is to observe a difference in sample means due to random sampling rather than an actual effect. Understanding this distribution allows researchers to make inferences about population parameters based on sample data, providing insight into the variability and significance of observed differences.
Sampling variability: Sampling variability refers to the natural fluctuations in sample statistics that occur when different samples are drawn from the same population. This concept highlights how sample outcomes can differ due to random chance, even when samples are selected under identical conditions. Understanding sampling variability is crucial for interpreting data accurately and making valid inferences about a population based on sample results.
Shape and symmetry: Shape and symmetry refer to the visual aspects and balance of a distribution in statistics, particularly when analyzing sampling distributions. The shape indicates how data points are distributed across a range of values, while symmetry refers to the balance of that distribution around a central point, typically the mean. Recognizing these characteristics helps in understanding the behavior of sample statistics and making inferences about populations.
Simple random sampling: Simple random sampling is a fundamental statistical method where each member of a population has an equal chance of being selected for the sample. This method ensures that the sample accurately reflects the characteristics of the larger population, which is essential for making valid inferences about it. By connecting this method to understanding populations, sampling distributions, and sample size determination, one can appreciate its role in achieving unbiased results in statistical analyses.
Standard Deviation: Standard deviation is a measure of the amount of variation or dispersion in a set of values, indicating how much individual data points differ from the mean. It helps in understanding the distribution and spread of data, making it essential for comparing variability across different datasets. A lower standard deviation signifies that the data points are closer to the mean, while a higher value indicates greater spread.
Standard Error: Standard error is a statistical measure that quantifies the amount of variability or dispersion of a sample mean from the true population mean. It is essentially an estimation of how far the sample mean is likely to be from the population mean, based on the sample size and the standard deviation of the sample. A smaller standard error indicates that the sample mean is a more accurate reflection of the true population mean, which connects directly to important concepts like sample size, variability, and the reliability of statistical estimates.
Statistic: A statistic is a numerical value that summarizes or describes a characteristic of a sample, which is a subset of a larger population. It is often used to estimate properties of the population from which the sample is drawn. By analyzing statistics, we can make inferences about population parameters and understand variability within data, which connects closely with how sampling works and the distributions that arise from different samples.
Stratified Sampling: Stratified sampling is a method of sampling that involves dividing a population into distinct subgroups, or strata, based on shared characteristics before randomly selecting samples from each stratum. This technique ensures that different segments of a population are adequately represented, leading to more accurate and reliable results in research. It connects to various statistical concepts, such as understanding the central limit theorem, assessing the nature of populations and samples, exploring the implications of sampling distributions, determining appropriate sample sizes, and distinguishing from other methods like cluster sampling.
T-distribution: The t-distribution is a probability distribution that is symmetric and bell-shaped, similar to the normal distribution, but has heavier tails. It is particularly useful when working with small sample sizes or when the population standard deviation is unknown, providing a more accurate estimate of the confidence intervals and hypothesis tests in these situations. Its shape varies based on degrees of freedom, which makes it essential for various statistical applications like sampling distributions and interval estimation.
Type I Error: A Type I error occurs when a statistical test incorrectly rejects a true null hypothesis, essentially signaling that an effect or difference exists when, in reality, it does not. This error is critical in hypothesis testing as it reflects the risk of claiming a false positive, leading to potentially misleading conclusions and decisions based on incorrect assumptions.
Type II Error: A Type II error occurs when a statistical test fails to reject a false null hypothesis, meaning that it incorrectly concludes that there is no effect or difference when one actually exists. This type of error is important to understand as it relates to the power of a test, sampling distributions, and decision-making in hypothesis testing, impacting how researchers interpret data and the reliability of their conclusions.
Unbiased Estimator: An unbiased estimator is a statistical estimator whose expected value equals the true value of the parameter it estimates. This means that, on average, it produces estimates that are correct, ensuring that systematic errors do not distort the results. In statistics, having an unbiased estimator is crucial for accurate inference and relates closely to concepts like expected value, sampling distributions, and the Rao-Blackwell theorem, which provides ways to improve estimators.
Variance of the Sampling Distribution: The variance of the sampling distribution refers to the measure of how much the sample means vary from the true population mean when multiple samples are taken. This concept is crucial in understanding how sample size affects the reliability of estimates; larger samples tend to produce a smaller variance in the sampling distribution, leading to more precise estimates of the population parameter.
© 2024 Fiveable Inc. All rights reserved.
AP® and SAT® are trademarks registered by the College Board, which is not affiliated with, and does not endorse this website.