Sample size determination is crucial for survey accuracy. Factors like precision, confidence level, and population variability affect how many people we need to survey. Getting it right means balancing statistical power with practical constraints.
Understanding these factors helps researchers design better studies. By considering things like response rates and sampling methods, we can make sure our results are reliable and meaningful. It's all about finding the sweet spot between accuracy and feasibility.
Precision and Accuracy
Understanding Margin of Error and Confidence Level
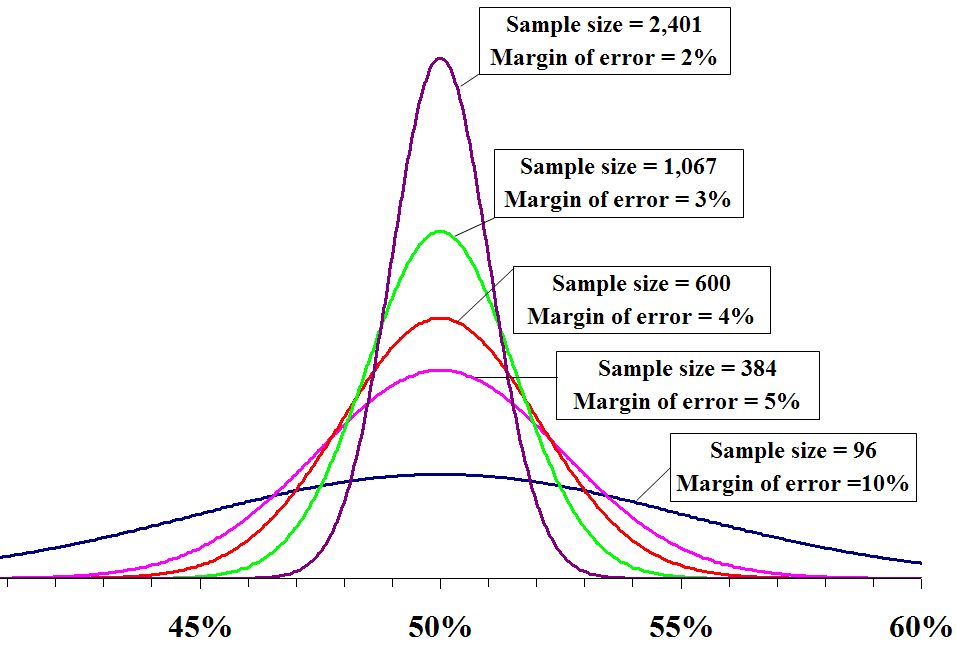
- Margin of error measures the maximum expected difference between the true population parameter and the sample estimate
- Expressed as a percentage, typically ranges from 1% to 10% in most surveys
- Smaller margin of error requires larger sample size to achieve greater precision
- Confidence level represents the probability that the true population parameter falls within the confidence interval
- Common confidence levels include 90%, 95%, and 99%
- Higher confidence level necessitates larger sample size to maintain the same margin of error
- Relationship between margin of error and confidence level affects sample size determination
- Narrower margin of error or higher confidence level increases required sample size
- Wider margin of error or lower confidence level decreases required sample size
Precision and Error Types in Statistical Analysis
- Precision refers to the closeness of repeated measurements to each other
- Measured by standard error, which decreases as sample size increases
- Increased precision leads to more reliable estimates and narrower confidence intervals
- Type I error occurs when rejecting a true null hypothesis (false positive)
- Probability of Type I error denoted by alpha (α), typically set at 0.05 or 0.01
- Type II error happens when failing to reject a false null hypothesis (false negative)
- Probability of Type II error represented by beta (β)
- Relationship between Type I and Type II errors influences sample size determination
- Lowering the risk of Type I error (smaller α) increases required sample size
- Reducing the risk of Type II error (smaller β) also increases required sample size

Population Characteristics
Population Variability and Effect Size
- Population variability measures the spread or dispersion of values in the population
- Higher variability requires larger sample size to achieve desired precision
- Commonly measured using standard deviation or variance
- Effect size quantifies the magnitude of the relationship or difference between groups
- Expressed in various ways (Cohen's d, Pearson's r, odds ratio)
- Larger effect sizes can be detected with smaller sample sizes
- Smaller effect sizes require larger sample sizes to maintain statistical power
- Researchers estimate effect size based on previous studies or pilot data
- Population variability and effect size together influence sample size calculations
- More variable populations with smaller effect sizes require larger samples
- Less variable populations with larger effect sizes allow for smaller samples
Response Rate Considerations
- Expected response rate affects the initial sample size determination
- Calculated as the number of completed surveys divided by the number of eligible respondents
- Lower response rates require larger initial sample sizes to achieve desired final sample size
- Factors influencing response rates include survey mode, topic salience, and incentives
- Strategies to improve response rates
- Multiple contact attempts (pre-notification, reminders)
- Mixed-mode surveys (combining online, phone, and mail methods)
- Offering incentives (monetary or non-monetary)
- Researchers often overestimate initial sample size to account for non-response
- Non-response bias can occur if non-respondents differ systematically from respondents
- Addressing non-response bias through weighting or imputation techniques
Study Design
Statistical Power and Resource Constraints
- Statistical power represents the probability of detecting a true effect when it exists
- Typically set at 80% or higher in most studies
- Influenced by sample size, effect size, significance level, and variability
- Larger sample sizes increase statistical power, improving the ability to detect effects
- Power analysis helps determine the minimum sample size needed to achieve desired power
- Resource constraints limit the maximum achievable sample size
- Budget limitations affect the number of participants that can be recruited or surveyed
- Time constraints may restrict the duration of data collection
- Personnel availability influences the capacity for data collection and analysis
- Balancing statistical power and resource constraints
- Prioritizing key research questions when resources are limited
- Considering multi-stage or adaptive sampling designs to optimize resource use
Sampling Design Considerations
- Sampling design influences the required sample size and overall study efficiency
- Simple random sampling often requires larger sample sizes compared to other methods
- Stratified sampling can reduce required sample size by improving precision
- Dividing the population into homogeneous subgroups (strata)
- Allocating sample sizes to strata proportionally or optimally
- Cluster sampling may increase required sample size due to design effect
- Design effect measures the efficiency loss compared to simple random sampling
- Intraclass correlation within clusters affects the design effect
- Multi-stage sampling combines multiple sampling methods
- Can balance precision and cost-effectiveness in complex populations
- May require larger overall sample sizes to account for each sampling stage
- Considering practical aspects of sampling design
- Accessibility of sampling units
- Availability of sampling frames
- Logistical challenges in data collection