Sensitivity analysis is a powerful tool for evaluating how changes in input variables affect a model's output. It helps identify critical factors, improve decision-making, and communicate risks effectively. This technique is essential for understanding uncertainties and assessing the robustness of models across various fields.
While sensitivity analysis offers numerous advantages, it's important to be aware of its limitations. The quality of results depends on the underlying model's assumptions and the proper interpretation of findings. Careful consideration of these factors is crucial for leveraging sensitivity analysis effectively in risk assessment and management.
Definition of sensitivity analysis
- Sensitivity analysis is a technique used to determine how changes in input variables affect the output of a model or system
- Involves systematically varying input parameters to assess their impact on the model's results
- Helps identify which variables have the greatest influence on the model's behavior and outcomes
Purpose of sensitivity analysis
- Sensitivity analysis serves to evaluate the robustness and reliability of a model or system
- Helps decision-makers understand the uncertainties and risks associated with a particular model or decision
- Provides insights into the relationships between input variables and model outputs, facilitating a better understanding of the system being analyzed
Advantages of sensitivity analysis
Identification of critical variables
- Sensitivity analysis helps identify the most influential input variables that have the greatest impact on the model's output
- Enables decision-makers to focus their attention and resources on the variables that matter most (critical success factors)
- Facilitates the prioritization of data collection and refinement efforts for the most important variables
Improved decision making
- By understanding the sensitivity of the model to different input variables, decision-makers can make more informed and robust decisions
- Sensitivity analysis helps assess the potential consequences of different decisions under various scenarios
- Enables the identification of optimal strategies and the selection of the most appropriate course of action
Communication of risk
- Sensitivity analysis provides a clear and transparent way to communicate the uncertainties and risks associated with a model or decision
- Helps stakeholders understand the potential range of outcomes and the factors that influence them
- Facilitates the development of contingency plans and risk mitigation strategies based on the identified sensitivities
Disadvantages of sensitivity analysis
Limitations of model assumptions
- Sensitivity analysis is only as good as the underlying model and its assumptions
- If the model is based on incorrect or oversimplified assumptions, the sensitivity analysis results may be misleading
- The analysis may not capture all the relevant uncertainties and complexities of the real-world system being modeled
Potential for misinterpretation
- Sensitivity analysis results can be misinterpreted if not properly communicated or understood
- Decision-makers may focus too much on the most sensitive variables while ignoring other important factors
- The analysis may create a false sense of precision or certainty, leading to overconfidence in the model's results
Types of sensitivity analysis
One-way sensitivity analysis
- Involves varying one input variable at a time while keeping all other variables constant
- Helps assess the impact of individual variables on the model's output
- Provides a straightforward way to identify the most influential variables and their relationships with the output
Two-way sensitivity analysis
- Involves varying two input variables simultaneously to assess their combined impact on the model's output
- Helps identify interactions and dependencies between variables
- Provides insights into how changes in one variable may affect the sensitivity of another variable
Multi-way sensitivity analysis
- Involves varying multiple input variables simultaneously to assess their combined impact on the model's output
- Helps identify complex interactions and dependencies among multiple variables
- Provides a more comprehensive understanding of the model's behavior under different scenarios
Steps in conducting sensitivity analysis
Identification of key input variables
- Involves identifying the input variables that are likely to have the greatest impact on the model's output
- May be based on expert judgment, historical data, or preliminary analysis
- Helps focus the sensitivity analysis on the most important variables
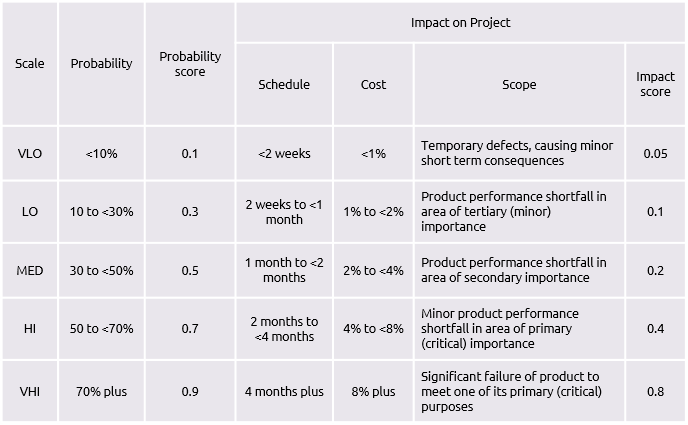
Determination of variable ranges
- Involves determining the plausible range of values for each input variable
- May be based on historical data, expert opinion, or statistical analysis
- Ensures that the sensitivity analysis covers a realistic and relevant range of scenarios
Calculation of model outputs
- Involves running the model with different combinations of input variable values
- May involve using specialized software or programming languages to automate the process
- Generates a set of output values corresponding to each combination of input variables
Interpretation of results
- Involves analyzing the sensitivity analysis results to identify patterns, trends, and key insights
- May involve using statistical techniques or data visualization tools to facilitate the interpretation
- Helps communicate the findings to decision-makers and stakeholders in a clear and meaningful way
Applications of sensitivity analysis
Financial risk assessment
- Sensitivity analysis is widely used in financial risk assessment to evaluate the impact of different variables on investment returns, project profitability, and portfolio performance
- Helps identify the key drivers of financial risk and assess the potential consequences of different scenarios (interest rates, market conditions)
- Enables the development of risk mitigation strategies and the selection of optimal investment or project options
Environmental risk assessment
- Sensitivity analysis is used in environmental risk assessment to evaluate the impact of different variables on ecosystem health, pollutant dispersion, and natural resource management
- Helps identify the key environmental factors that influence the system's behavior and assess the potential consequences of different scenarios (climate change, land use patterns)
- Enables the development of environmental management strategies and the selection of appropriate conservation or remediation measures
Health risk assessment
- Sensitivity analysis is used in health risk assessment to evaluate the impact of different variables on public health outcomes, disease transmission, and treatment effectiveness
- Helps identify the key factors that influence health risks and assess the potential consequences of different scenarios (exposure levels, population characteristics)
- Enables the development of public health interventions and the selection of appropriate prevention or treatment strategies
Sensitivity analysis vs scenario analysis
- Sensitivity analysis focuses on assessing the impact of changes in individual input variables on the model's output, while scenario analysis evaluates the model's behavior under specific sets of conditions or scenarios
- Sensitivity analysis helps identify the most influential variables and their relationships with the output, while scenario analysis provides insights into the potential outcomes under different plausible futures
- Sensitivity analysis is typically more focused on the model's internal structure and behavior, while scenario analysis is more concerned with the external factors and conditions that may affect the system being modeled
Integration of sensitivity analysis in risk management
Identification of risk mitigation strategies
- Sensitivity analysis helps identify the key variables that contribute to risk and the potential consequences of different scenarios
- Enables the development of targeted risk mitigation strategies that address the most significant risk factors
- Helps prioritize risk management efforts and allocate resources effectively
Prioritization of risk management efforts
- Sensitivity analysis provides a structured way to prioritize risk management efforts based on the most influential variables and their potential impact
- Helps focus attention and resources on the risks that matter most and have the greatest potential for causing harm
- Enables the development of a risk-based approach to decision making and resource allocation
Best practices for sensitivity analysis
Documentation of assumptions
- It is important to clearly document the assumptions and limitations of the sensitivity analysis to ensure transparency and reproducibility
- Documentation should include the rationale for selecting input variables, the ranges of values considered, and any simplifying assumptions made
- Helps others understand the context and limitations of the analysis and facilitates future updates or refinements
Use of appropriate sensitivity ranges
- The ranges of values used for each input variable should be carefully selected to reflect realistic and relevant scenarios
- Overly narrow or wide ranges may lead to misleading or uninformative results
- The selection of sensitivity ranges should be based on a combination of historical data, expert judgment, and statistical analysis
Consideration of interdependencies
- Sensitivity analysis should consider the potential interdependencies and interactions among input variables
- Ignoring important interdependencies may lead to an incomplete or inaccurate understanding of the system's behavior
- Techniques such as two-way or multi-way sensitivity analysis can help capture these interdependencies and provide a more comprehensive assessment
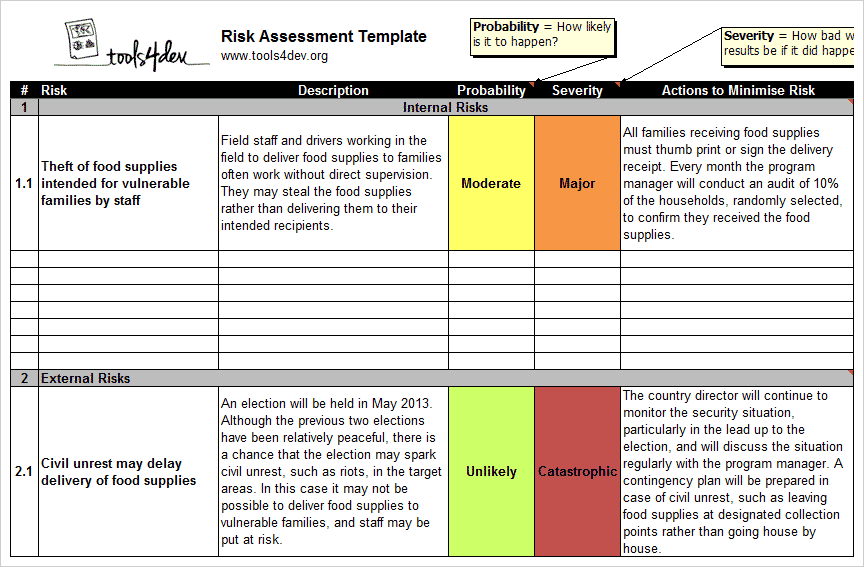
Presentation of results
- The results of the sensitivity analysis should be presented in a clear, concise, and visually appealing manner to facilitate understanding and communication
- The use of graphs, charts, and other data visualization tools can help highlight key insights and trends
- The presentation should be tailored to the needs and preferences of the intended audience, whether they are technical experts or non-technical stakeholders