5.1 Point estimation and properties of estimators

2 min readjuly 24, 2024

is a crucial statistical technique for making educated guesses about population characteristics. By using a single value from sample data, we can estimate unknown population parameters like means, proportions, and variances.

Good estimators have key properties that make them reliable. They should be unbiased, efficient, consistent, and robust. Understanding these properties helps us choose the best estimators and interpret results accurately in real-world scenarios.

Understanding Point Estimation

Purpose of point estimation

Top images from around the web for Purpose of point estimation
  • Point estimation uses single value (statistic) to estimate based on sample data
  • Makes inferences about population characteristics approximating unknown parameters (mean, proportion, variance)
  • estimates population mean, estimates population proportion

Properties of effective estimators

  • ensures expected value of estimator equals true parameter value E(θ^)=θE(\hat{\theta}) = \theta
  • minimizes variance among unbiased estimators measured by relative efficiency ratio
  • converges estimator to true parameter as sample size increases
  • contains all sample information about parameter
  • performs well under assumption departures

Calculation of point estimates

  • Sample mean xˉ=1ni=1nxi\bar{x} = \frac{1}{n}\sum_{i=1}^n x_i estimates population mean
  • Sample proportion p^=xn\hat{p} = \frac{x}{n} estimates population proportion where x = successes
  • s2=1n1i=1n(xixˉ)2s^2 = \frac{1}{n-1}\sum_{i=1}^n (x_i - \bar{x})^2 estimates population variance
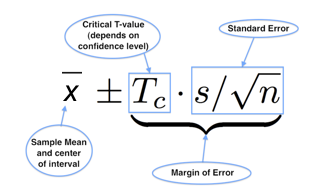
  • Interpret estimates with context considering and confidence intervals

Role of sampling distributions

  • shows statistic distribution over all possible samples of given size
  • states mean sampling distribution approaches normal as sample size increases
  • measures estimator precision as sampling distribution standard deviation
  • Enables assessment of estimator properties, construction, hypothesis testing

Key Terms to Review (15)

Central Limit Theorem: The Central Limit Theorem states that when independent random variables are added together, their normalized sum tends to follow a normal distribution, regardless of the original distribution of the variables, as the sample size increases. This theorem is crucial because it underpins many statistical methods by allowing for the approximation of sampling distributions and the estimation of population parameters using sample statistics.
Confidence Interval: A confidence interval is a range of values used to estimate an unknown population parameter, providing a measure of uncertainty around that estimate. It reflects the degree of confidence that the true population parameter lies within this range, usually expressed at a certain level, such as 95% or 99%. This concept is crucial for making informed decisions based on sample data, as it connects estimation processes with hypothesis testing and regression analysis.
Consistency: Consistency in statistics refers to the property of an estimator whereby, as the sample size increases, the estimator converges in probability to the true parameter value being estimated. This means that with larger samples, the estimates become more reliable and closer to the actual value, highlighting the importance of sample size in statistical inference.
Efficiency: Efficiency refers to the quality of an estimator that measures how well it utilizes the available data to produce estimates. In statistics, an efficient estimator is one that has the smallest possible variance among all unbiased estimators, leading to more reliable and precise estimates. This concept is crucial for understanding the performance of point estimators and making decisions based on statistical analyses.
Margin of error: The margin of error is a statistic that expresses the amount of random sampling error in a survey's results. It reflects the uncertainty surrounding an estimate and indicates how much the results could differ from the true population value. This concept plays a crucial role in hypothesis testing, estimation, and determining confidence intervals, as it helps quantify the reliability of statistical conclusions drawn from sample data.
Point Estimation: Point estimation is a statistical technique used to provide a single value, or estimate, for an unknown parameter based on sample data. This method is crucial for making inferences about population characteristics and is foundational for understanding how estimates can impact decision-making in various contexts. The reliability of a point estimate can be evaluated through properties of estimators, and its significance extends to forming confidence intervals that provide a range of plausible values for the parameter being estimated.
Population Parameter: A population parameter is a numerical value that summarizes or describes a characteristic of an entire population. This could include metrics like the population mean, variance, or proportion. Population parameters are crucial for understanding the larger context of data and form the basis for statistical inference, allowing us to make educated guesses about the entire population from sample data.
Robustness: Robustness refers to the ability of a statistical method or model to perform well under a variety of conditions, including the presence of outliers or violations of assumptions. A robust estimator or simulation technique is less sensitive to small changes in the data or underlying assumptions, allowing for more reliable and consistent results across different scenarios.
Sample mean: The sample mean is the average value calculated from a subset of a population, representing an estimate of the population mean. It is a fundamental statistic used in decision-making processes and provides a basis for inference about the overall population, linking it to key concepts such as estimation, hypothesis testing, and measures of central tendency.
Sample proportion: Sample proportion is the ratio of a certain characteristic or outcome present in a sample, expressed as a fraction of the total number of observations in that sample. This measure is essential in statistics, as it serves as a point estimate for the true population proportion, allowing analysts to make inferences about the entire population based on the observed data from a sample.
Sample variance: Sample variance is a measure of how much individual data points in a sample differ from the sample mean, calculated by averaging the squared differences between each data point and the mean. This statistic provides insights into the variability or spread of the data, which is essential when making inferences about the population from which the sample is drawn.
Sampling distribution: A sampling distribution is the probability distribution of a statistic obtained through repeated sampling from a population. It describes how the statistic varies from sample to sample and is crucial for making inferences about the population based on sample data. Understanding the properties of sampling distributions helps assess the reliability and variability of estimators used in point estimation.
Standard Error: Standard error is a statistical term that measures the accuracy with which a sample represents a population. It indicates the extent to which sample means are expected to vary from the true population mean due to random sampling. Understanding standard error is essential when conducting hypothesis testing, making estimates, and interpreting results, as it helps quantify uncertainty in the estimates derived from sample data.
Sufficiency: Sufficiency refers to a property of a statistic that ensures it captures all the information needed from the data to estimate a parameter. A sufficient statistic condenses the information contained in the sample without losing any relevant details, making it particularly useful for point estimation.
Unbiasedness: Unbiasedness refers to a property of an estimator in statistics, where the expected value of the estimator equals the true value of the parameter being estimated. This means that, on average, the estimator neither overestimates nor underestimates the parameter. An unbiased estimator is crucial because it ensures that repeated sampling will produce accurate estimates over time.
© 2024 Fiveable Inc. All rights reserved.
AP® and SAT® are trademarks registered by the College Board, which is not affiliated with, and does not endorse this website.