Six Sigma is a powerful methodology for improving business processes and quality. It uses statistical tools and a structured approach to reduce defects, minimize variation, and enhance customer satisfaction. The core principles drive organizational excellence through data-driven decisions and a customer-centric focus.

The process (Define, Measure, Analyze, Improve, Control) forms the backbone of Six Sigma implementation. This systematic approach helps organizations identify problems, measure performance, analyze root causes, implement improvements, and maintain long-term control of processes.

Six Sigma Fundamentals

Principles of Six Sigma methodology

Top images from around the web for Principles of Six Sigma methodology
  • Core principles of Six Sigma drive organizational excellence through data-driven decisions, process improvement focus, and customer-centric approach
  • Objectives of Six Sigma aim to reduce process variation, minimize defects and errors (3.4 DPMO), improve overall quality, and enhance customer satisfaction
  • Statistical foundation relies on six standard deviations from the mean, representing 3.4 defects per million opportunities
  • Organizational roles in Six Sigma include Champion (executive sponsor), Master Black Belt (expert trainer), Black Belt (project leader), and Green Belt (team member)
  • Key metrics assess , , and sigma level to measure performance and improvement

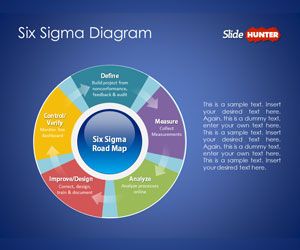
Phases of DMAIC process

  1. Define phase identifies problem statement, determines project scope, sets goals, and creates project charter
  2. Measure phase collects baseline data, validates measurement system, and determines process capability
  3. Analyze phase identifies root causes, develops hypotheses, and conducts statistical analysis
  4. Improve phase generates potential solutions, selects and implements best options, and validates improvements
  5. Control phase standardizes processes, implements control plans, and monitors long-term performance

Six Sigma Implementation

Application of Six Sigma tools

  • Statistical tools analyze data and trends (control charts, Pareto analysis, histogram, scatter plot)
  • techniques identify underlying issues (fishbone diagram, , )
  • Process mapping visualizes workflows and identifies improvement opportunities (, )
  • Design of Experiments optimizes processes through factorial designs and response surface methodology
  • Lean tools integration enhances efficiency (5S, Kanban, Poka-yoke)

Six Sigma in continuous improvement

  • culture fosters ongoing enhancement through philosophy and
  • prioritizes Voice of the Customer and characteristics
  • Performance measurement tracks progress using KPIs and Balanced Scorecard
  • Financial impact assessed through Cost of Poor Quality and ROI of Six Sigma projects
  • Organizational benefits include improved efficiency, enhanced employee engagement, and competitive advantage
  • Integration with other methodologies (Lean Six Sigma, TQM) amplifies improvement efforts
  • Sustainability of improvements ensured through process control plans and ongoing monitoring and adjustment

Key Terms to Review (22)

5 Whys: The 5 Whys is a problem-solving technique that involves asking 'why' five times to explore the cause-and-effect relationships underlying a particular problem. This method helps to identify the root cause of an issue, promoting a deeper understanding and facilitating effective solutions. It's commonly used in quality improvement and process management, making it a key element in methodologies focused on efficiency and quality control.
Continuous Improvement: Continuous improvement is an ongoing effort to enhance products, services, or processes by making small, incremental changes over time. This concept aims to foster a culture where feedback is valued, and employees are encouraged to seek out ways to improve their work and the overall efficiency of the organization. Through this approach, businesses can adapt more effectively to changes in the market and enhance their competitiveness.
Control Chart: A control chart is a statistical tool used to monitor the consistency and stability of a process over time by plotting data points against control limits. It helps identify variations in a process that may indicate issues needing correction, ensuring that the process operates within specified limits. This tool is vital for understanding performance and quality management in various applications, including manufacturing and service industries.
Critical to quality: Critical to quality (CTQ) refers to the key measurable characteristics of a product or service that must be met in order to satisfy customer requirements and expectations. CTQs are used in the Six Sigma methodology to identify areas where quality improvement is needed, ensuring that products or services meet the necessary standards to deliver value and satisfaction to customers.
Customer focus: Customer focus is a business philosophy that prioritizes understanding and meeting the needs and preferences of customers to drive satisfaction and loyalty. This approach involves actively seeking feedback, anticipating customer requirements, and tailoring products and services to exceed expectations, ultimately fostering long-term relationships with clients.
Defect rate: The defect rate is a measure used to quantify the number of defects in a given process or production run, typically expressed as a percentage of the total items produced. It reflects the quality level of a manufacturing process or service and is crucial for identifying areas needing improvement, especially in methodologies focused on minimizing errors and maximizing efficiency.
Dmadv: DMADV stands for Define, Measure, Analyze, Design, and Verify. It is a data-driven quality strategy used to design new processes or products in Six Sigma methodology. The DMADV framework is particularly important when existing processes do not meet customer needs or when new products are being developed, ensuring that they align with quality standards and customer satisfaction from the outset.
Dmaic: DMAIC is a data-driven quality strategy used for improving processes and is an integral part of Six Sigma methodology. It stands for Define, Measure, Analyze, Improve, and Control, which are the five phases that guide teams in problem-solving and process optimization. Each phase plays a critical role in identifying issues, quantifying performance, and ensuring sustainable improvements over time.
FMEA: Failure Mode and Effects Analysis (FMEA) is a systematic method used to identify potential failure modes in a process, product, or service and assess their impact on overall performance. It aims to prioritize risks based on their severity, occurrence, and detection, helping organizations to improve reliability and prevent failures before they occur.
Hypothesis Testing: Hypothesis testing is a statistical method used to make decisions about a population based on sample data. It involves formulating a null hypothesis and an alternative hypothesis, collecting data, and determining whether to reject the null hypothesis using statistical tests. This process is crucial for making informed management decisions, as it provides a structured approach to assess claims about population parameters.
Joseph Juran: Joseph Juran was a key figure in quality management, known for his contributions to the development of quality control and improvement processes. His work emphasized the importance of management’s role in quality and introduced the concept of the 'Quality Trilogy,' which consists of quality planning, quality control, and quality improvement. This framework is integral to the Six Sigma methodology as it aligns with the goal of reducing defects and improving processes in organizations.
Kaizen: Kaizen is a Japanese term that means 'continuous improvement' and refers to the philosophy of constantly seeking ways to enhance processes, products, and services through incremental changes. This approach emphasizes the importance of all employees contributing ideas for improvement, fostering a culture of teamwork and problem-solving. In the context of business practices, kaizen is closely associated with efficiency and waste reduction.
Pareto Chart: A Pareto chart is a type of bar graph that represents the frequency or impact of problems or causes in a process, arranged in descending order from left to right. This visual tool helps identify the most significant factors contributing to an issue, based on the principle that roughly 80% of effects come from 20% of the causes, often referred to as the 80/20 rule. By focusing efforts on these key areas, organizations can maximize their improvement initiatives and drive effective decision-making.
PDCA Cycle: The PDCA Cycle, also known as the Deming Cycle, is a four-step iterative process used for continuous improvement in management and quality control. It consists of four phases: Plan, Do, Check, and Act, which guide organizations in testing and implementing changes effectively. This cycle is integral to both monitoring processes and ensuring ongoing enhancements in performance and quality.
Process capability: Process capability refers to the ability of a process to produce output that meets specified limits and tolerances. It is a key measure of how well a process can consistently produce products within defined quality standards, reflecting the inherent variation in the process and its stability over time. Understanding process capability helps organizations improve efficiency, reduce waste, and enhance customer satisfaction by ensuring products are manufactured to meet specifications.
Regression analysis: Regression analysis is a statistical method used to determine the relationships between variables, often to predict outcomes based on one or more predictor variables. It helps in understanding how the dependent variable changes when any one of the independent variables is varied while the other independent variables are held constant. This method is essential for making informed decisions in various areas, including quality improvement and strategic management.
Root Cause Analysis: Root Cause Analysis (RCA) is a systematic process for identifying the underlying causes of problems or defects in order to prevent their recurrence. It emphasizes finding not just the immediate symptoms of an issue but rather the deeper, often systemic factors that led to it. This approach is critical for continuous improvement efforts, helping organizations minimize defects and optimize processes.
SIPOC Diagram: A SIPOC diagram is a high-level visual tool used in process management that stands for Suppliers, Inputs, Process, Outputs, and Customers. It helps teams understand and map out the essential elements of a process, allowing for clearer communication and identification of areas for improvement. This diagram is particularly useful in the context of Six Sigma methodology as it provides a framework to define the scope of a project and ensures that everyone involved has a common understanding of the process.
Standard Deviation: Standard deviation is a measure of the amount of variation or dispersion in a set of values, indicating how much the individual data points differ from the mean. It helps in understanding the spread of data and is critical for assessing reliability and consistency in various analyses.
Value stream mapping: Value stream mapping is a visual tool used to analyze and design the flow of materials and information required to bring a product or service to a consumer. This method highlights the value-added and non-value-added activities within a process, helping organizations identify areas for improvement. By creating a visual representation of the current state, teams can better understand workflows and work towards optimizing processes to reduce waste and enhance efficiency.
Variance: Variance is a statistical measure that quantifies the degree of dispersion or spread in a set of data points relative to their mean. It helps to understand how much individual data points deviate from the average value, which is crucial for making informed decisions in various fields, including management.
W. Edwards Deming: W. Edwards Deming was an American statistician, professor, author, and consultant, widely recognized for his contributions to quality management and continuous improvement. He developed a philosophy that emphasized the importance of using statistical methods to improve processes and products, which laid the groundwork for modern quality initiatives like Six Sigma. His teachings advocate for a systematic approach to management that focuses on enhancing efficiency and effectiveness through data-driven decision-making.
© 2024 Fiveable Inc. All rights reserved.
AP® and SAT® are trademarks registered by the College Board, which is not affiliated with, and does not endorse this website.