Linear regression is a powerful tool for predicting outcomes based on input variables. In finance, it's often used to forecast revenue based on factors like advertising spend. By calculating slope and y-intercept, we can create a model to estimate future results.
The best-fit linear model helps us understand the relationship between variables and make predictions. We can interpret the slope to see how changes in one variable affect another, and use the equation to forecast outcomes for different scenarios.
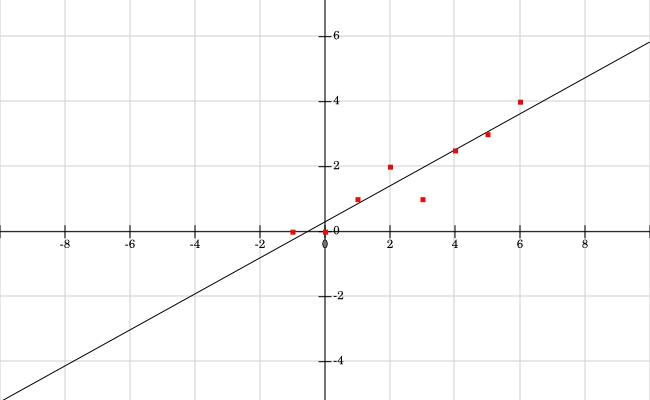
Best-Fit Linear Model
Slope and y-intercept calculation
- Slope () measures the change in the dependent variable () for a one-unit change in the independent variable ()
- Formula:
- and represent individual data points (advertising expenditure and revenue)
- and are the means of and (average advertising expenditure and average revenue)
- Formula:
- Y-intercept () is the value of the dependent variable when the independent variable equals zero
- Formula:
- Represents the predicted revenue when advertising expenditure is zero
- Formula:
- Calculating slope and y-intercept in Excel:
- Use the
SLOPE()function to calculate - Use the
INTERCEPT()function to calculate
- Use the
- Calculating slope and y-intercept on a financial calculator:
- Enter data points into the calculator (advertising expenditure and revenue pairs)
- Use the linear regression function to obtain and

Interpretation of regression slope
- The slope represents the marginal impact of the independent variable (predictor variable) on the dependent variable (response variable)
- In a revenue prediction model based on advertising expenditure:
- The slope measures the additional revenue generated for each additional unit of advertising expenditure (dollar per dollar spent)
- A positive slope indicates that increasing advertising expenditure leads to higher revenue (common scenario)
- A negative slope would imply that increasing advertising expenditure decreases revenue (unlikely in most cases)
- In a revenue prediction model based on advertising expenditure:
- The magnitude of the slope indicates the sensitivity of the dependent variable to changes in the independent variable
- A larger slope suggests a stronger relationship between advertising expenditure and revenue
- A smaller slope suggests a weaker relationship between the variables
Revenue prediction using linear models
- The best-fit linear model is represented by the equation:
- is the predicted revenue
- is the advertising expenditure
- is the slope of the regression line
- is the y-intercept
- To make revenue predictions:
- Substitute the desired advertising expenditure value for in the equation
- Calculate the predicted revenue () using the slope () and y-intercept () from the regression model
- Limitations and considerations when using linear models for prediction:
- The accuracy of predictions depends on the strength of the linear relationship between advertising expenditure and revenue
- A higher R-squared value indicates a better fit and more reliable predictions
- Predictions are most reliable within the range of observed data points (interpolation)
- Extrapolating beyond the observed data range may lead to less accurate predictions (forecasting future revenue for significantly higher or lower advertising expenditure)
- Other factors not included in the model may also influence revenue (economic conditions, competitor actions, product quality)
- The linear model assumes that advertising expenditure is the only variable affecting revenue, which may be an oversimplification
- The accuracy of predictions depends on the strength of the linear relationship between advertising expenditure and revenue
Model Evaluation and Statistical Analysis
- Scatter plots are used to visualize the relationship between variables and identify potential linear trends
- Ordinary least squares (OLS) is a common method used to estimate the parameters of the linear regression model
- Statistical significance of the model is assessed through hypothesis testing, which helps determine if the relationship between variables is meaningful or due to chance