Equation of a Sinusoidal Function
In this guide, you will learn how to construct the equation of a sinusoidal function from a graph. There are a few steps involved in the process, and this topic will give you an even deeper understanding of the equation we saw in the previous guide. To construct the equation of a sinusoidal function from a graph of the function, we can use the properties of the function to determine the parameters in the equation.
The general form of the equation of a sinusoidal function is:
or
Where:
- is the amplitude, which is half the distance between the maximum and minimum values of the function.
- is the coefficient that determines the period and frequency of the function.
- is the horizontal shift, which determines the position of the function along the x-axis.
- is the vertical shift, which determines the position of the function along the y-axis.

Constructing the Equation
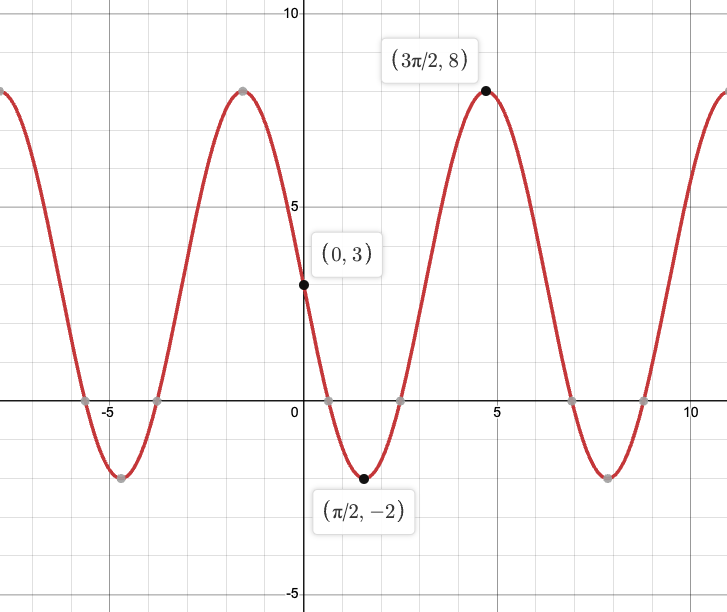
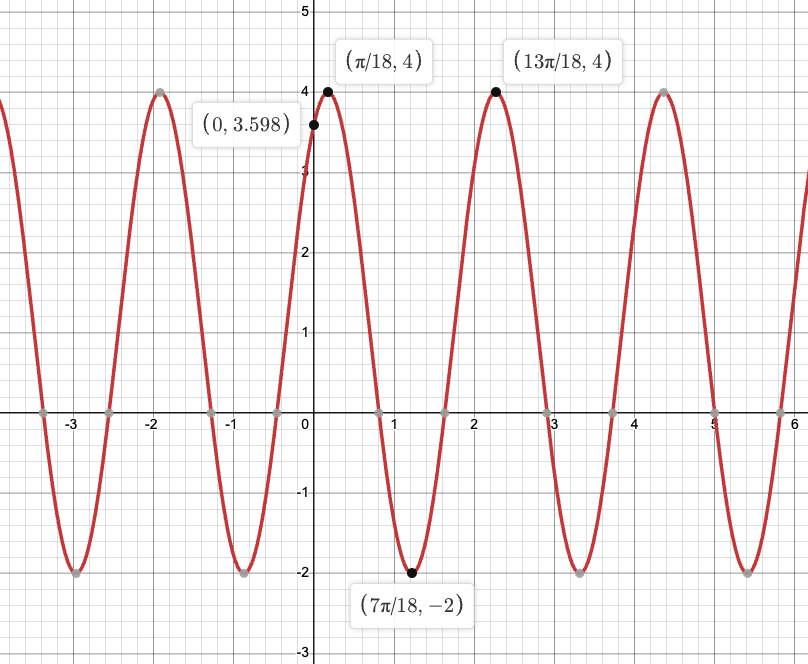
Consider the graph below. Let's try to find the sinusoidal equation for this function.

To determine the amplitude of the function, we can measure the distance between the maximum and minimum y-values on the graph and divide by 2. The minimum y-value is -4, and the maximum y-value is 4. Adding together the absolute values of these numbers and dividing by two, we get an amplitude of 4.
To determine the period and frequency of the function, we can look at the x-values of the points where the function repeats its maximum or minimum values. The period of the function is the distance between these x-values, and the frequency is the reciprocal of the period. For the graph above, the function peaks at , and the next peak is at . Therefore, the period of the function is . The frequency, the value that goes into the equation, is the inverse of the period. However, for sinusoidal functions, since the period of the sine function is , the frequency of a sinusoidal function can be calculated by . In this case, the frequency would be , or .
To determine the vertical shift of the function, we can look at the position of the function along the x- and y-axis. The vertical shift is the value of the shift of the midline of the function. The original sine function has a midline at , so by finding the midline of the graph, you will be able to find the vertical shift. The midline can be calculated by adding together the maximum and minimum y-values and dividing by 2, but without taking their absolute value. For this graph, the midline is calculated using , so the midline is at and the vertical shift is 0. Notice how we used the negative in the value of the minimum of the graph, unlike before when we were calculating amplitude.
To determine the phase shift of the functions, you need to find the other values of the function first. Since we have determined these values, we can use a point on the function and our equation to find the phase shift (horizontal shift). We can substitute the values we found into the equation, and our point, to solve for the phase shift. Picking the point, (1, 4), we can solve for the phase shift like this:
Our phase shift is 0. Remember that the argument of the sine function (what goes inside the parentheses) is in radians, not degrees.
Once we have determined the values of these parameters, we can substitute them into the general form of the equation to get the equation of the sinusoidal function.
amplitude =
period =
frequency =
horizontal (phase) shift =
vertical shift =
This is the equation of the sinusoidal function represented by the given graph.
Practice Problems
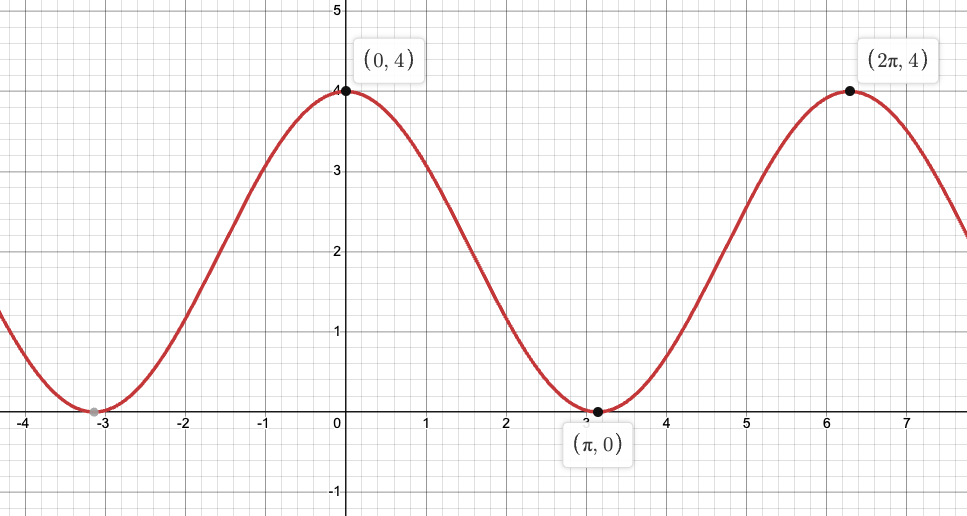
Construct the equations of the graphs below.
1.
Answer:
2.
Answer:
3.
Answer:
Vocabulary
The following words are mentioned explicitly in the College Board Course and Exam Description for this topic.
| Term | Definition |
|---|---|
| amplitude | The absolute value of the coefficient a in a sinusoidal function, representing the maximum distance from the midline to the peak or trough of the graph. |
| contextual domain | The range of input values for which a sinusoidal function model is meaningful and applicable within a real-world context. |
| frequency | The number of complete cycles of a sinusoidal function that occur over a unit interval of input values. |
| period | The smallest positive value k such that a periodic function repeats its pattern, meaning f(x+k) = f(x) for all x in the domain. |
| periodic phenomena | Events or patterns that repeat at regular intervals over time or space. |
| phase shift | A horizontal translation of a sinusoidal function represented by the constant c, which shifts the graph left or right by -c units. |
| sinusoidal function | A function of the form f(θ) = a sin(b(θ + c)) + d or g(θ) = a cos(b(θ + c)) + d, where a, b, c, and d are real numbers and a ≠ 0. |
| sinusoidal regression | A statistical method using technology to fit a sinusoidal function to a data set by estimating the best-fit parameters. |
| vertical shift | A vertical translation of a sinusoidal function represented by the additive constant d, which moves the entire graph up or down and shifts the midline. |
Frequently Asked Questions
How do I find the amplitude of a sinusoidal function from a data set?
Look at the max and min output values in your data. Amplitude = (max − min)/2. The midline (vertical shift) is (max + min)/2. So if your highest measured value is 18 and lowest is 6, amplitude = (18 − 6)/2 = 6 and midline = 12. If the data are noisy, estimate peaks (or average several nearby points) to get max/min, or use a sinusoidal regression on your calculator/tech to fit a model (CED 3.7.A.4). Remember CED 3.7.A.2 says max and min determine amplitude and vertical shift; CED 3.7.A.1 says use consecutive maxima/minima to get period so you can complete the model. For AP prep, practice this on sample FRQ 3-style problems (modeling a periodic context)—see the Topic 3.7 study guide (https://library.fiveable.me/ap-pre-calculus/unit-3/sinusoidal-function-context-data-modeling/study-guide/NfgWcSvLUIRp9XqiYfQy). For extra practice across Unit 3, try the unit overview (https://library.fiveable.me/ap-pre-calculus/unit-3) and the practice problem bank (https://library.fiveable.me/practice/ap-pre-calculus).
What's the formula for writing a sine function that models real world data?
Use a general sine model: f(x) = A sin(B(x − C)) + D. - Amplitude A = (max − min)/2 (vertical dilation). - Midline / vertical shift D = (max + min)/2. - Period T = distance between consecutive maxima (or minima); B = 2π / T (if using radians) or B = 360°/T (if using degrees). - Phase shift C: find horizontal shift so the argument B(x − C) lines up with a known point (e.g., a maximum at x = x0 gives B(x0 − C) = π/2 for sine starting at midline rising, or use whichever phase equation matches your chosen sine/cosine form). - Frequency = 1/T. In practice: estimate max/min and consecutive peaks from data (CED 3.7.A.1–3), compute A, D, T, then solve for C using one data point (CED 3.7.A.3). You can also use sinusoidal regression/least-squares with technology (CED 3.7.A.4). For exam calculator work, keep angle units in radians (AP requires radian mode for calculator parts). For a step-by-step AP-focused guide, see the Topic 3.7 study guide (https://library.fiveable.me/ap-pre-calculus/unit-3/sinusoidal-function-context-data-modeling/study-guide/NfgWcSvLUIRp9XqiYfQy). For extra practice, check the unit page (https://library.fiveable.me/ap-pre-calculus/unit-3) and the practice problem bank (https://library.fiveable.me/practice/ap-pre-calculus).
When do I use sine vs cosine for modeling periodic data?
Use the shape at your starting point (t = 0) to pick the base function—then add a phase shift if needed. - Choose cosine when the data at t = 0 is at a peak (or trough). cos(0)=1 so A cos(B(t−C))+D naturally starts at a max (if A>0) or min (if A<0) on the midline D. - Choose sine when t = 0 is at the midline (and heading up or down). sin(0)=0, so A sin(B(t−C))+D starts at the midline D and then moves according to the sign of A. If the start point doesn’t match either pattern, use a horizontal (phase) shift C to align the model with observed maxima/minima or a known data point (CED 3.7.A.3). Always determine amplitude = (max−min)/2, midline D = (max+min)/2, and period T from consecutive peaks: B = 2π/T (or use degrees). For AP modeling problems (FRQ 3) you’ll be asked to find A, B, C, D from context—show how you used maxima/minima and period to get each parameter. For targeted practice and step-by-step examples, see the Topic 3.7 study guide (https://library.fiveable.me/ap-pre-calculus/unit-3/sinusoidal-function-context-data-modeling/study-guide/NfgWcSvLUIRp9XqiYfQy) and thousands of practice problems (https://library.fiveable.me/practice/ap-pre-calculus).
How do I calculate the period from a graph or table of values?
Look for one full cycle—the smallest input interval after which the pattern (peaks, troughs, or shape) repeats. From a graph: measure the horizontal distance between consecutive maxima (or consecutive minima)—that distance is the period. From a table: find two x-values where the function has the same phase (e.g., two consecutive peaks, two troughs, or two identical zero-crossings with the same direction) and subtract: period = x2 − x1. Example: peaks at x = 2 and x = 8 → period = 6. Then frequency = 1/period. If angles are in radians, be sure to report the period in radians (and set calculators to radian mode for AP tasks). This is exactly 3.7.A.1 in the CED (use consecutive maxima/minima to estimate period). For more examples and practice, check the Topic 3.7 study guide (https://library.fiveable.me/ap-pre-calculus/unit-3/sinusoidal-function-context-data-modeling/study-guide/NfgWcSvLUIRp9XqiYfQy) and more practice problems (https://library.fiveable.me/practice/ap-pre-calculus).
I don't understand how to find the phase shift - can someone explain step by step?
Phase shift is the horizontal shift C in y = A·sin(B(x − C)) + D (or cosine). Step-by-step: 1. Find midline D = (max + min)/2 and amplitude A = (max − min)/2 (CED 3.7.A.2). 2. Find period: measure distance between consecutive maxima (or minima). Period = that distance. Then B = 2π / period (CED 3.7.A.1). 3. Decide whether sin or cos is easier: use cosine if you have a peak (cos(0)=1), use sine if you have a midline crossing with increasing slope (sin(0)=0). (CED 3.7.A.3) 4. Locate a key point x0 from the data (e.g., a peak at x = x0). Write the reference x for that feature in the base function: for cos, reference angle = 0 so C = x0; for sin, if x0 is a midline rising, C = x0. More generally solve B(x0 − C) = reference angle ⇒ C = x0 − (reference angle)/B. 5. Plug A, B, C, D into the formula and check against another data point; adjust choice of sin vs cos if needed. Remember AP short answers expect clear use of max/min → amplitude and period → B, then solve for C. For review and examples, check the Topic 3.7 study guide (https://library.fiveable.me/ap-pre-calculus/unit-3/sinusoidal-function-context-data-modeling/study-guide/NfgWcSvLUIRp9XqiYfQy) and practice problems (https://library.fiveable.me/practice/ap-pre-calculus).
What's the difference between amplitude and vertical shift in sinusoidal models?
Amplitude tells you how tall the wiggle is; vertical shift (midline) tells you where the whole sine/cosine wave sits up or down. Use the max and min: midline = (max + min)/2 (that’s the vertical shift from y = 0), and amplitude = (max − min)/2 (the distance from the midline to a peak). Example: if max = 10 and min = 2, midline = (10+2)/2 = 6 and amplitude = (10−2)/2 = 4, so the model looks like 4·sin(...) + 6 (or cos). On the AP exam you’ll use maxima/minima to find these in sinusoidal modeling (see CED 3.7.A.2); FRQ 3 specifically asks you to determine amplitude and vertical translation. For a quick refresher and practice problems tied to this topic, check the Topic 3.7 study guide (https://library.fiveable.me/ap-pre-calculus/unit-3/sinusoidal-function-context-data-modeling/study-guide/NfgWcSvLUIRp9XqiYfQy) and the Unit 3 overview (https://library.fiveable.me/ap-pre-calculus/unit-3). For extra questions, try the AP Precalc practice set (https://library.fiveable.me/practice/ap-pre-calculus).
How do I know if my sinusoidal model is accurate for the data?
You check accuracy two ways: by comparing key features and by checking residuals. First confirm your model’s parameters match the data’s measured features—period (distance between consecutive maxima/minima), amplitude (half peak-to-peak), and midline/vertical shift—and adjust phase so an actual point lines up (CED 3.7.A.1–3). Plot the model against the data and look at residuals (data − model): small, randomly scattered residuals mean a good fit; a clear pattern means the sinusoid is missing something (CED 3.7.A.4, least-squares idea). Use technology to compute sinusoidal regression and stats (SSE, R²) to quantify fit; higher R² and lower SSE indicate better accuracy. Finally, check context limits: even a good fit may only be valid over the contextual domain (CED 3.7.A.5). For practice, review Topic 3.7 study guide (https://library.fiveable.me/ap-pre-calculus/unit-3/sinusoidal-function-context-data-modeling/study-guide/NfgWcSvLUIRp9XqiYfQy) and try problems from the unit (https://library.fiveable.me/ap-pre-calculus/unit-3) or the practice bank (https://library.fiveable.me/practice/ap-pre-calculus).
Can I use my calculator to find a sinusoidal regression and how?
Yes—many graphing calculators and apps can find a sinusoidal (sin/cos) regression, but exact steps depend on your device. General method: - Enter your data into lists (L1, L2). - If your calculator has a built-in SinReg/CosReg option, run it (Stat → Calc → SinReg or similar) to get A, B, C, D for y = A sin(B(x − C)) + D. - If there’s no built-in sinusoid, use nonlinear regression: store a model like Y1 = A*sin(B*(X − C)) + D, choose a regression routine (or use a solver/curve-fit) and give initial guesses for A,B,C,D. - Always check fit by plotting the model over the data and looking at residuals. AP-specific tips: calculators are required for Part B multiple-choice and Part A FRQs (set in radian mode for trig work). But remember some FRQs (like FRQ 3) expect you to construct models without tech, so know how to estimate amplitude, midline, period, and phase shift from peaks/troughs (CED 3.7.A.1–3). For a focused review, see the Topic 3.7 study guide (https://library.fiveable.me/ap-pre-calculus/unit-3/sinusoidal-function-context-data-modeling/study-guide/NfgWcSvLUIRp9XqiYfQy) and grab practice problems at (https://library.fiveable.me/practice/ap-pre-calculus).
How do I find the maximum and minimum values to determine amplitude and vertical shift?
Take the highest and lowest output values (from the graph or data). Then: - Amplitude = (maximum − minimum) / 2. Example: if peak = 12 and trough = 4, amplitude = (12 − 4)/2 = 4. - Vertical shift (midline) = (maximum + minimum) / 2. Same example: midline = (12 + 4)/2 = 8, so the sinusoid oscillates about y = 8. How to get those numbers in practice: read the peak and trough values from the labeled graph or from your data table (use consecutive maxima/minima to confirm repeating behavior per CED 3.7.A.1). If data’s noisy, estimate peak/trough by averaging nearby high/low points or use a sinusoidal regression on your calculator (AP Part A allows a graphing calculator; keep radian mode when required). Don’t forget the model is usually only valid over the contextual domain (CED 3.7.A.5). For a quick refresher, see the Topic 3.7 study guide (https://library.fiveable.me/ap-pre-calculus/unit-3/sinusoidal-function-context-data-modeling/study-guide/NfgWcSvLUIRp9XqiYfQy). For extra practice problems, try the AP Precalculus practice page (https://library.fiveable.me/practice/ap-pre-calculus).
What does it mean when they say the model is only useful over the contextual domain?
It means the sinusoidal equation you built only makes sense for the x-values that match the real-world situation you modeled—not for all real numbers. In Topic 3.7 terms: you used period, amplitude, midline, and phase shift estimated from observed cycles, so the model reliably predicts dependent-variable values only over the contextual domain where those cycles actually occur (e.g., days in a year, hours of operation, the time window of your data). Outside that domain you may violate assumptions (different forcing factors, one-off events, trend changes), so the periodic pattern and residual behavior can break down and predictions become misleading. On the AP exam, always state the model’s domain and justify limitations when asked in a real-world FRQ (see FRQ 3 in the CED). For more guidance and examples, check the Topic 3.7 study guide (https://library.fiveable.me/ap-pre-calculus/unit-3/sinusoidal-function-context-data-modeling/study-guide/NfgWcSvLUIRp9XqiYfQy) and try practice problems (https://library.fiveable.me/practice/ap-pre-calculus).
I'm confused about how to match input-output pairs to find phase shift - help?
Phase shift comes from comparing a real data point to where a basic sine/cosine would hit that same value once you’ve fixed amplitude, midline, and period. Quick how-to: 1. Find amplitude A and vertical shift d from max/min: A = (max − min)/2, d = (max + min)/2. 2. Estimate period P from distance between consecutive maxima (or minima). Then b = 2π/P (use radians on the AP exam unless told degrees). 3. Pick a convenient reference: cosine has its max at angle 0, sine has its max at π/2. Choose the one that makes solving easiest. 4. Use a known input-output pair (x0, y0). If you use cosine model y = A cos(b(x − c)) + d and you observed a maximum at x0, then c = x0. If you use sine y = A sin(b(x − c)) + d and you observed a maximum at x0, then set b(x0 − c) = π/2 so c = x0 − π/(2b). 5. Check: plug a second data point into the full model to confirm or tweak the sign/phase (cosine vs. sine) and units. Example: if consecutive maxima are 8 units apart, P = 8 so b = π/4. If a max is at x = 3 and you pick cosine, phase shift c = 3. For more worked examples and AP-style practice, see the Topic 3.7 study guide (https://library.fiveable.me/ap-pre-calculus/unit-3/sinusoidal-function-context-data-modeling/study-guide/NfgWcSvLUIRp9XqiYfQy) and extra problems (https://library.fiveable.me/practice/ap-pre-calculus).
How do I construct a sinusoidal function model from scratch using data points?
Start by identifying key features from the data: midline, amplitude, period, and a phase reference point. 1. Amplitude and vertical shift: amplitude A = (max − min)/2. Midline (vertical shift) d = (max + min)/2. 2. Period and b: find the distance Δx between consecutive maxima (or minima). Period T = Δx. Then b = 2π/T (use radians on the AP exam when required). 3. Choose a basic form (sine or cosine). Cosine is convenient if a data point is a peak: y = A cos(b(x − h)) + d. Sine is fine if you know where the curve crosses the midline going up. 4. Phase shift h: plug one known (x,y) into the chosen form and solve for h (or solve for a horizontal shift using inverse trig). 5. Check and refine: plug other data points. If you have lots of noisy data, use sinusoidal regression on a calculator or tech for least-squares fitting (allowed in Part A tasks). Keep work in exact trig/radian form where possible for FRQ 3; tech can estimate parameters (CED 3.7.A). For a step-by-step walk-through and practice problems, see the Topic 3.7 study guide (https://library.fiveable.me/ap-pre-calculus/unit-3/sinusoidal-function-context-data-modeling/study-guide/NfgWcSvLUIRp9XqiYfQy), the Unit 3 overview (https://library.fiveable.me/ap-pre-calculus/unit-3), and extra practice (https://library.fiveable.me/practice/ap-pre-calculus).
When modeling real world phenomena, how do I know what the independent and dependent variables should be?
Pick the quantity you control or that naturally “drives” the situation as the independent variable; pick the quantity you want to predict or measure as the dependent variable. Practically: - Ask “what changes first?” or “what would I plug in?” Time is the most common independent variable for periodic phenomena (days, hours, seconds)—e.g., day → minutes of daylight. - The dependent variable is the response you measure (temperature, height, depth, daylight minutes). It’s what your sinusoidal model will predict. - Always record units and domain (contextual domain matters—sinusoidal models often only make sense over a realistic time window; CED 3.7.A.5). - Use the context to identify amplitude, midline, period from independent-variable intervals (CED 3.7.A.1–A.3). - If unsure, check cause → effect: the cause is independent; the observable effect is dependent. For practice, use the Topic 3.7 study guide (https://library.fiveable.me/ap-pre-calculus/unit-3/sinusoidal-function-context-data-modeling/study-guide/NfgWcSvLUIRp9XqiYfQy) and try modeling problems from the AP unit page (https://library.fiveable.me/ap-pre-calculus/unit-3) or practice sets (https://library.fiveable.me/practice/ap-pre-calculus).
What's the step by step process for creating a sine function from periodic data?
1) Plot or list the data and identify repeating key points (consecutive maxima or minima) to estimate the period P (CED 3.7.A.1). Period = distance between consecutive peaks; frequency = 1/P. 2) Find max and min values to get amplitude A = (max − min)/2 and midline D = (max + min)/2 (CED 3.7.A.2). 3) Choose a basic form: y = A sin(B(x − C)) + D or use cosine if a peak lines up with x = 0. Compute B = 2π/P (use radians on the AP exam). 4) Find phase shift C by matching a specific data point: plug its x and y into the model and solve for C (CED 3.7.A.3). If you used cosine but data starts at a trough/zero, shift accordingly. 5) Check units and context (domain), refine using another data point, and adjust sign if the curve is flipped (negative A). 6) If noisy or many points, use technology: sinusoidal regression or least-squares fitting to estimate parameters (CED 3.7.A.4). 7) Validate by comparing model outputs to data and only use predictions within the contextual domain (CED 3.7.A.5). For step-by-step examples and AP-aligned practice, see the Topic 3.7 study guide (https://library.fiveable.me/ap-pre-calculus/unit-3/sinusoidal-function-context-data-modeling/study-guide/NfgWcSvLUIRp9XqiYfQy), the full Unit 3 overview (https://library.fiveable.me/ap-pre-calculus/unit-3), and extra practice problems (https://library.fiveable.me/practice/ap-pre-calculus).
Why does my sinusoidal model work for some x-values but not others?
If your sinusoidal model matches some x-values but misses others, it’s usually one (or more) of these AP-approved reasons: - wrong period/phase: if you estimated period from nonconsecutive peaks or used degrees vs. radians in your calculator, peaks won’t line up (CED 3.7.A.1, 3.7.A.3). - wrong amplitude/midline: bad max/min estimates give the curve the wrong height or vertical shift (CED 3.7.A.2). - contextual/domain limits: real-world data often isn’t perfectly sinusoidal everywhere—models often only work over the contextual domain they were fit to (CED 3.7.A.5). Extrapolating beyond that can fail. - noise or additional trends: data may include trend, damping, or random error; a single sine/cosine can’t capture that. - sampling issues: sparse or uneven data can give a misleading fit. Check consecutive maxima to get period, use max/min for amplitude/midline, and compare actual points to model to refine phase (see Topic 3.7 study guide: https://library.fiveable.me/ap-pre-calculus/unit-3/sinusoidal-function-context-data-modeling/study-guide/NfgWcSvLUIRp9XqiYfQy). For more practice, use the unit overview (https://library.fiveable.me/ap-pre-calculus/unit-3) and AP precalc practice problems (https://library.fiveable.me/practice/ap-pre-calculus).