Fluorescence Spectroscopy Principles
Fluorescence spectroscopy relies on the energy difference between absorbed and emitted photons. The Stokes shift quantifies this difference, while the mirror image rule describes the symmetry between absorption and emission spectra. Together, these concepts are essential for interpreting fluorescence data and designing sensitive detection methods.
Stokes Shift in Fluorescence Spectroscopy
The Stokes shift is the difference in energy (or equivalently, wavelength/wavenumber) between the absorption maximum and the emission maximum of a fluorophore. Emitted photons are always lower in energy than absorbed photons, so the emission spectrum is red-shifted relative to absorption.
Why does this matter practically? The Stokes shift allows you to separate excitation light from emission light using optical filters. A larger shift makes this separation easier, which directly improves detection sensitivity.
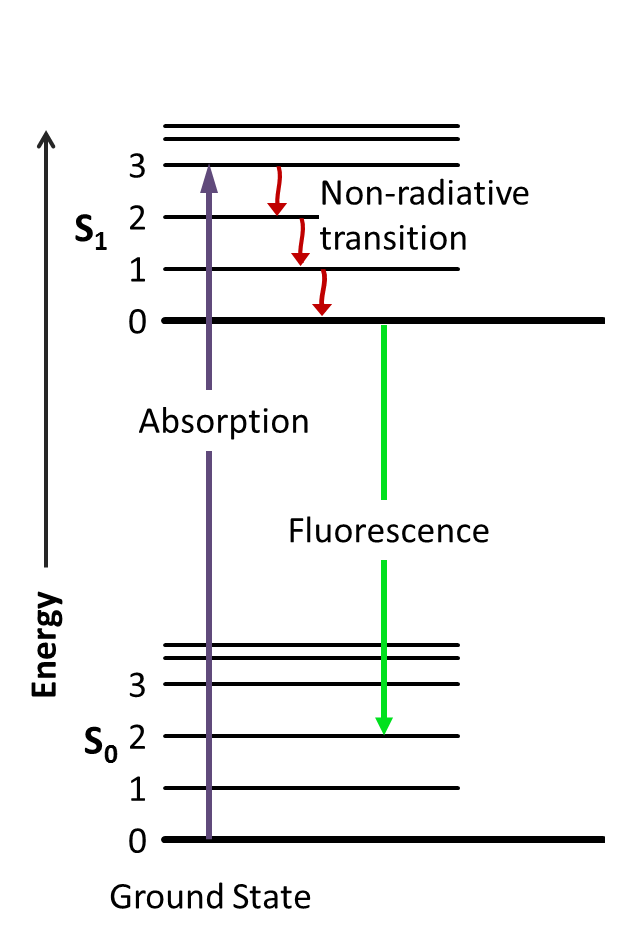
The energy "lost" between absorption and emission comes from several relaxation processes:
- Vibrational relaxation — After absorbing a photon, the molecule lands in a vibrationally excited level of the excited electronic state. It quickly sheds that excess vibrational energy as heat to the surrounding medium (typically on a picosecond timescale), relaxing to the lowest vibrational level of .
- Internal conversion — Non-radiative transfer of energy between electronic states of the same spin multiplicity (e.g., ) further dissipates energy before emission occurs.
- Solvent reorganization — Solvent molecules reorient around the new charge distribution of the excited state, stabilizing it and lowering its energy. This is especially significant in polar solvents when the fluorophore has a large excited-state dipole moment.
All three processes reduce the energy available for the emitted photon, producing the observed red shift.
Mirror Image Rule for Spectra
For many organic fluorophores (rhodamine, fluorescein, anthracene), the emission spectrum is an approximate mirror image of the absorption spectrum when plotted on a wavenumber scale. The axis of symmetry falls near the 0–0 transition, where no vibrational quanta are gained or lost.
This symmetry arises because the Franck-Condon principle governs both absorption and emission. During absorption, vertical transitions from the level of populate various vibrational levels of , with intensities determined by the overlap of vibrational wavefunctions. During emission, the process reverses: transitions from of populate vibrational levels of with a similar pattern of Franck-Condon factors. If the potential energy surfaces of and have similar shapes (similar vibrational frequencies and spacing), the vibronic progressions in absorption and emission will be mirror images of each other.
The mirror image rule breaks down when:
- Excited-state reactions change the molecular structure before emission occurs (e.g., excited-state proton transfer, tautomerization).
- Excimer or exciplex formation creates a new emissive species with a different potential energy surface than the initially excited monomer.
- The geometry of differs substantially from , altering vibrational frequencies enough to distort the symmetry.
Factors Affecting Stokes Shift
Several molecular and environmental factors determine the magnitude of the Stokes shift:
Solvent polarity. If the fluorophore's dipole moment changes significantly upon excitation, polar solvents will stabilize the excited state through reorientation. Greater solvent polarity leads to greater stabilization and a larger Stokes shift. The Lippert-Mataga equation formalizes this relationship, connecting the Stokes shift to the solvent's orientation polarizability and the change in dipole moment.
Conformational relaxation. Some molecules undergo structural changes in the excited state, such as twisting or bending. These geometry changes lower the energy of relative to the Franck-Condon state, increasing the Stokes shift. Rigid molecules like anthracene and perylene have small Stokes shifts because their geometry barely changes upon excitation.
Electronic structure. Electron-donating or electron-withdrawing substituents modify the charge distribution in the excited state. Intramolecular charge transfer (ICT) states, common in push-pull fluorophores, often exhibit large Stokes shifts because the excited-state dipole moment is much larger than the ground-state dipole.
Energy transfer. Förster resonance energy transfer (FRET) from a donor to an acceptor produces emission at the acceptor's wavelength, which can appear as an apparent Stokes shift much larger than either molecule alone would show.
Interpretation of Fluorescence Spectra
Reading a fluorescence spectrum involves both qualitative and quantitative analysis.
Calculating the Stokes shift. Express both maxima in wavenumber units and take the difference:
For example, if absorption peaks at 25,000 and emission at 22,000 , the Stokes shift is 3,000 . Using wavenumbers rather than wavelengths gives a value directly proportional to energy.
What the shift tells you:
- A large Stokes shift (e.g., PRODAN, ~5,000 in polar solvents) indicates significant excited-state relaxation, often involving charge transfer and solvent reorganization.
- A small Stokes shift (e.g., perylene, ~500 ) suggests the molecule's geometry and electronic distribution change very little upon excitation.
Spectral overlap. The region where absorption and emission spectra overlap matters because it enables self-absorption and self-quenching. At high fluorophore concentrations, emitted photons can be reabsorbed by neighboring molecules, distorting the emission spectrum and reducing apparent quantum yield.
Environmental sensitivity. Solvatochromic fluorophores like ANS shift their emission wavelength depending on solvent polarity or binding environment. Tracking these shifts lets you probe local polarity in membranes, protein binding sites, or other microenvironments. Similarly, pH-sensitive dyes like acridine orange shift spectra upon protonation or deprotonation.
Time-resolved measurements. Collecting emission spectra at different delay times after excitation reveals how the spectrum evolves as solvent relaxation and conformational changes proceed. Early-time spectra appear blue-shifted, while later spectra are red-shifted, directly mapping the dynamics of excited-state relaxation.