Logistic regression is a powerful tool for binary classification, using the sigmoid function to predict probabilities. It's the go-to method for problems like spam detection or disease diagnosis, where we need to decide between two outcomes.
The model's coefficients tell us how each feature affects the odds of a positive outcome. By understanding odds ratios, we can interpret the impact of each variable on our predictions, making logistic regression both effective and insightful.
Logistic Regression Basics
The Logistic Function and Binary Classification
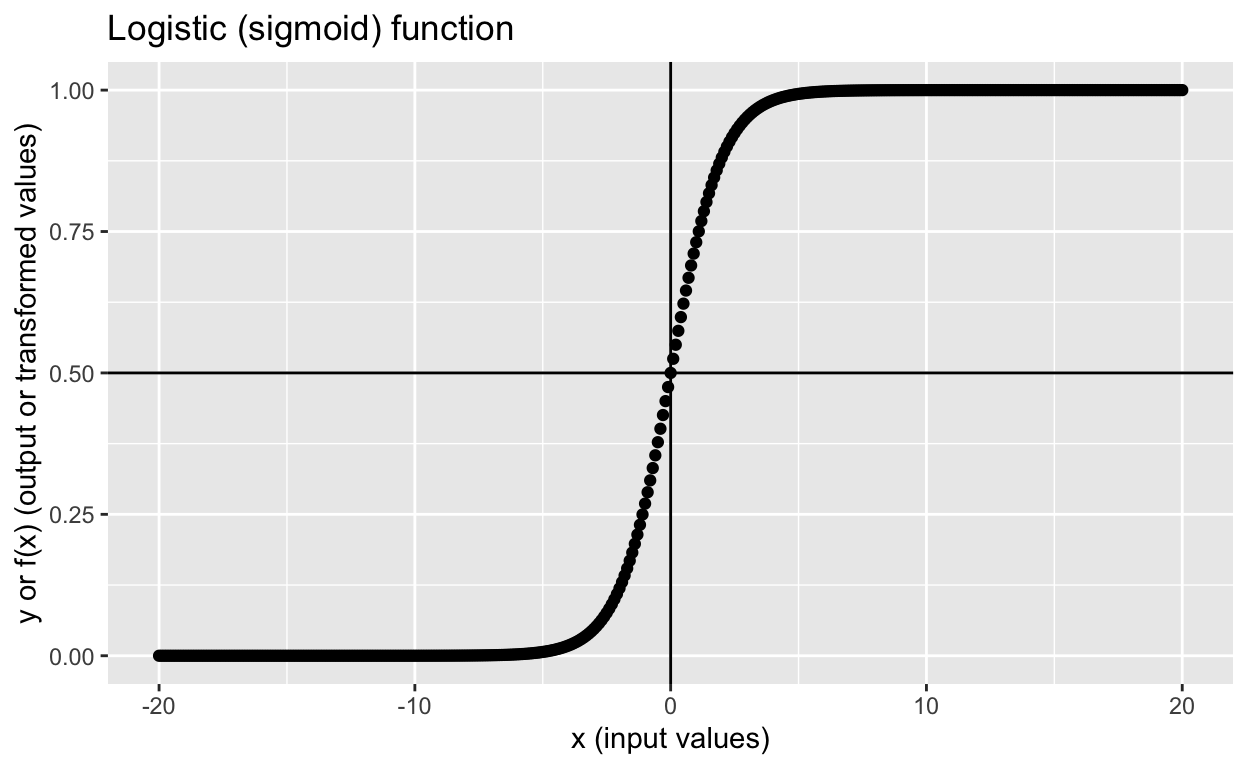
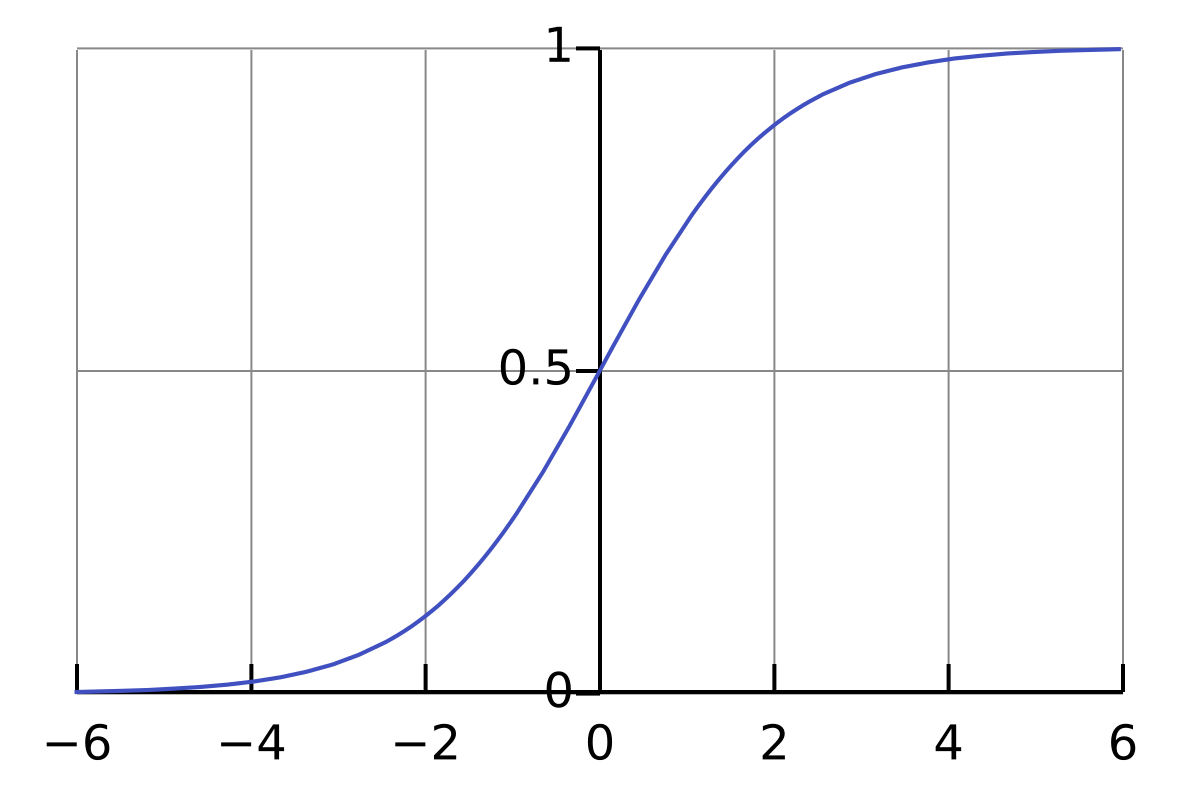
- Logistic regression uses the logistic function, also known as the sigmoid function, to model the probability of a binary outcome
- The logistic function maps any real-valued number to a value between 0 and 1, representing a probability
- Denoted as: , where is the input and is the output probability
- Logistic regression is commonly used for binary classification problems, where the goal is to predict one of two possible outcomes (positive class or negative class)
- Examples include predicting whether an email is spam or not, whether a patient has a disease or not, or whether a customer will churn or not
- The logistic function produces a probability estimate between 0 and 1, which can be interpreted as the likelihood of the positive class
- A probability greater than 0.5 is typically classified as the positive class, while a probability less than 0.5 is classified as the negative class
Decision Boundaries and Predicted Probabilities
- Logistic regression learns a decision boundary that separates the two classes in the feature space
- The decision boundary is a hyperplane in the feature space where the predicted probability is equal to 0.5
- Points on one side of the decision boundary are classified as the positive class, while points on the other side are classified as the negative class
- The predicted probabilities in logistic regression can be used to assess the confidence of the model's predictions
- A probability close to 0 or 1 indicates high confidence in the prediction, while a probability near 0.5 indicates uncertainty
- The predicted probabilities can be useful for ranking instances based on their likelihood of belonging to a particular class
Model Estimation and Interpretation
Maximum Likelihood Estimation and Logit Transformation
- Logistic regression models are typically estimated using the maximum likelihood estimation (MLE) method
- MLE finds the model parameters that maximize the likelihood of observing the given data
- The likelihood function for logistic regression is based on the Bernoulli distribution, as each observation is either a success (1) or failure (0)
- The logit transformation, also known as the log-odds, is a key concept in logistic regression
- The logit transformation is defined as: , where is the probability of the positive class
- The logit transformation maps probabilities from the range [0, 1] to the entire real line, allowing for a linear relationship between the features and the log-odds
Interpretation of Coefficients and Odds Ratios
- The coefficients in a logistic regression model represent the change in the log-odds of the positive class for a one-unit increase in the corresponding feature, holding other features constant
- A positive coefficient indicates that an increase in the feature value is associated with an increase in the log-odds of the positive class
- A negative coefficient indicates that an increase in the feature value is associated with a decrease in the log-odds of the positive class
- The odds ratio is another way to interpret the coefficients in a logistic regression model
- The odds ratio is the exponentiated value of a coefficient, representing the change in the odds of the positive class for a one-unit increase in the corresponding feature
- An odds ratio greater than 1 indicates an increase in the odds of the positive class, while an odds ratio less than 1 indicates a decrease in the odds
- For example, if the odds ratio for a feature is 2, it means that a one-unit increase in that feature doubles the odds of the positive class, holding other features constant
Extensions and Regularization
Multinomial Logistic Regression
- Multinomial logistic regression, also known as softmax regression, is an extension of binary logistic regression for multi-class classification problems
- It allows for predicting the probabilities of more than two classes simultaneously
- The softmax function is used to normalize the predicted probabilities, ensuring they sum to 1 across all classes
- In multinomial logistic regression, a separate set of coefficients is learned for each class, relative to a reference class
- The predicted probability of each class is calculated using the softmax function applied to the linear combination of features and class-specific coefficients
- The class with the highest predicted probability is typically chosen as the predicted class
Regularization in Logistic Regression
- Regularization techniques, such as L1 (Lasso) and L2 (Ridge) regularization, can be applied to logistic regression to prevent overfitting and improve model generalization
- Regularization adds a penalty term to the loss function, discouraging large coefficient values and promoting simpler models
- L1 regularization encourages sparsity by driving some coefficients to exactly zero, effectively performing feature selection
- L2 regularization encourages small but non-zero coefficients, reducing the impact of individual features without completely eliminating them
- The strength of regularization is controlled by a hyperparameter (e.g., ) that balances the trade-off between fitting the training data and keeping the coefficients small
- A higher value of the regularization hyperparameter leads to stronger regularization and simpler models
- Cross-validation is often used to select an appropriate value for the regularization hyperparameter, optimizing for generalization performance on unseen data