Dimensionality reduction techniques go beyond PCA, offering diverse ways to simplify complex data. Linear methods like and , along with non-linear approaches such as and , provide powerful tools for visualizing and analyzing high-dimensional datasets.

and round out the toolkit, enabling interpretable representations and feature learning. These techniques are crucial for tackling the challenges of high-dimensional data in machine learning and statistical prediction.

Linear Techniques

Principal Component Analysis (PCA)

  • Unsupervised technique reduces dimensionality by projecting data onto lower dimensions
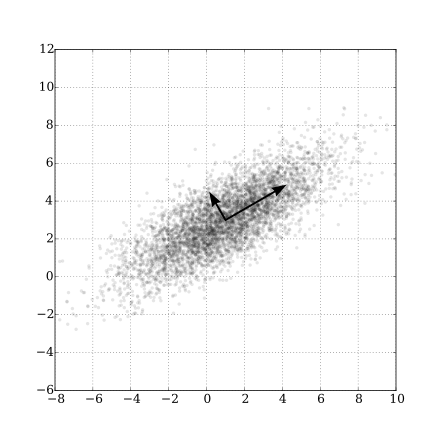
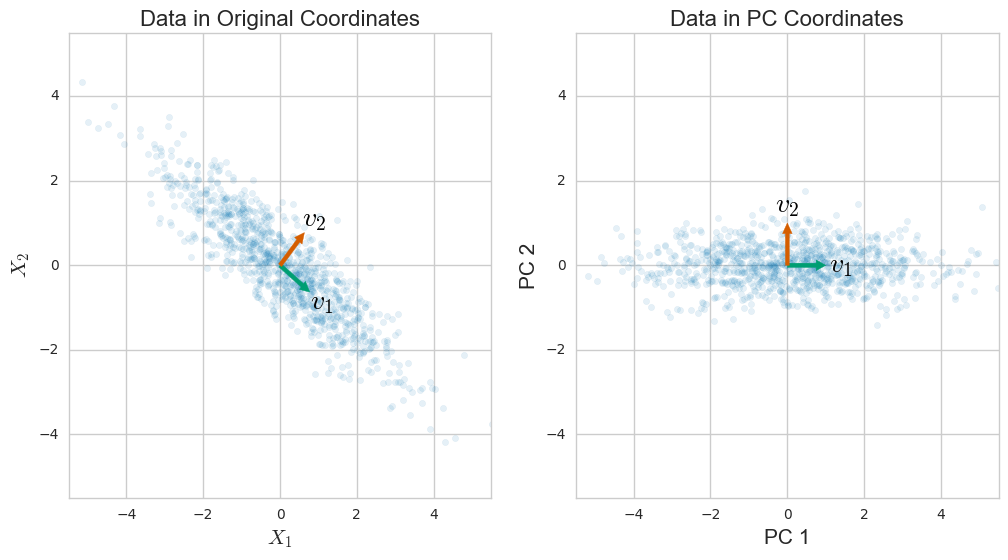
  • Finds principal components, which are directions of maximum variance in high-dimensional data
  • First principal component captures the most variance possible, followed by second component orthogonal to first, and so on
  • Preserves global structure of data while minimizing information loss
  • Applications include data compression, , and

Linear Discriminant Analysis (LDA) and Factor Analysis

  • LDA is supervised dimensionality reduction technique finds linear combinations of features best separates classes
  • Maximizes between-class separability while minimizing within-class variability
  • Useful for classification tasks and visualizing class separability in lower-dimensional space
  • Factor Analysis is similar to PCA but assumes underlying generate observed variables
  • Latent factors are unobserved variables that influence multiple observed variables (stock market returns influenced by economic growth and investor sentiment)
  • Goal is to identify and extract these latent factors to understand underlying structure of data

Independent Component Analysis (ICA)

  • Separates multivariate signal into additive subcomponents assuming non-Gaussian and statistically independent
  • Useful for separating mixed signals into original sources (cocktail party problem: separating individual voices from mixed audio recordings)
  • Recovers original signals by maximizing statistical independence between estimated components
  • Applications include signal processing, feature extraction, and blind source separation

Non-linear Techniques

t-SNE (t-Distributed Stochastic Neighbor Embedding)

  • Non-linear dimensionality reduction technique for visualization of high-dimensional data
  • Preserves local structure of data points in high-dimensional space when projecting to lower dimensions
  • Calculates probabilities of similarity between data points in original space and lower-dimensional space
  • Minimizes between joint probabilities in high and low dimensions to preserve local structure
  • Useful for visualizing complex datasets (visualizing clusters in image or text data)

UMAP (Uniform Manifold Approximation and Projection) and Kernel PCA

  • UMAP is non-linear dimensionality reduction technique based on and topological data analysis
  • Assumes data lies on low-dimensional manifold embedded in high-dimensional space
  • Constructs weighted graph representing manifold and optimizes low-dimensional representation to preserve graph structure
  • More computationally efficient than t-SNE and better preserves global structure of data
  • Kernel PCA is non-linear extension of PCA uses kernel trick to map data to higher-dimensional feature space
  • Performs PCA in this feature space to capture non-linear relationships in original data
  • Choice of kernel function (Gaussian, polynomial) determines type of non-linear transformation applied

Matrix Factorization

Non-negative Matrix Factorization (NMF)

  • Dimensionality reduction technique factorizes non-negative matrix into two non-negative matrices
  • Approximates original matrix as product of two lower-rank matrices
  • Useful when data has inherent non-negativity (image pixels, word counts in documents)
  • Generates interpretable parts-based representations of data (facial features in images, topics in text documents)
  • Applications include image and audio processing, recommender systems, and topic modeling

Autoencoders

  • Neural network architecture learns compressed representation of input data
  • Consists of encoder network maps input to lower-dimensional latent space and decoder network reconstructs input from latent representation
  • Trained to minimize between original input and reconstructed output
  • Latent space represents compressed representation capturing important features of data
  • Variations include denoising autoencoders (corrupted input), variational autoencoders (probabilistic latent space), and sparse autoencoders (sparsity constraints on latent representation)
  • Applications include dimensionality reduction, feature learning, and anomaly detection

Key Terms to Review (19)

Autoencoders: Autoencoders are a type of artificial neural network designed to learn efficient representations of data, typically for the purpose of dimensionality reduction or feature learning. They consist of an encoder that compresses the input into a lower-dimensional representation and a decoder that reconstructs the output from this representation. This makes them particularly useful for tasks like data compression and denoising, as well as more complex applications such as generative modeling.
Clustering: Clustering is a technique used in unsupervised learning to group similar data points together based on their characteristics or features. This method helps identify patterns and structures in data without predefined labels, making it essential for tasks like market segmentation, image recognition, and anomaly detection. By organizing data into clusters, it becomes easier to analyze and interpret large datasets, which is crucial for effective decision-making.
Embedding space: An embedding space is a mathematical representation of data in a lower-dimensional space while preserving meaningful relationships between the original data points. This transformation helps in visualizing, analyzing, and performing computations on complex datasets, making it easier to uncover patterns or insights that may not be apparent in the higher-dimensional original space.
Feature Extraction: Feature extraction is the process of transforming raw data into a set of attributes or features that can be effectively used in machine learning models. By focusing on relevant information and reducing noise, this technique enables more efficient data analysis and improved model performance. It is crucial for tasks such as dimensionality reduction, where the aim is to simplify datasets while retaining their essential characteristics, and is often applied in various domains including image processing, natural language processing, and more.
ICA: Independent Component Analysis (ICA) is a computational technique used to separate a multivariate signal into additive, independent non-Gaussian components. It is especially useful in situations where the observed data is a mixture of signals and the goal is to recover the original source signals, which is not easily achieved with techniques like PCA that focus on variance.
Kullback-Leibler Divergence: Kullback-Leibler divergence (often abbreviated as KL divergence) is a measure of how one probability distribution differs from a second reference probability distribution. This concept is crucial in assessing model performance and comparing distributions, which ties into various approaches for model selection and evaluation, as well as methods for dimensionality reduction that optimize the representation of data.
Latent factors: Latent factors are unobserved variables that influence observed variables in a dataset, capturing underlying patterns and structures. They play a crucial role in dimensionality reduction techniques, as they help to explain the correlations among observed variables while simplifying the data into fewer dimensions.
Latent variables: Latent variables are unobserved or hidden factors that cannot be directly measured but are inferred from observed data. They play a crucial role in statistical modeling, helping to explain relationships between observed variables and providing insights into underlying structures within the data.
LDA: LDA, or Linear Discriminant Analysis, is a statistical technique used for dimensionality reduction and classification that focuses on finding a linear combination of features that best separates two or more classes. It works by maximizing the ratio of between-class variance to within-class variance, which helps enhance class separability in lower-dimensional spaces. This makes LDA particularly useful in situations where the goal is to minimize misclassification while retaining as much information as possible.
Linear transformation: A linear transformation is a mathematical operation that takes a vector as input and produces another vector as output, while preserving the operations of vector addition and scalar multiplication. This means that if you add two vectors or multiply a vector by a scalar, the transformation will yield results consistent with these operations. In the context of dimensionality reduction, linear transformations are essential for techniques that simplify data without losing its essential structure.
Manifold learning: Manifold learning is a type of non-linear dimensionality reduction technique that aims to discover the underlying structure of high-dimensional data by mapping it into a lower-dimensional space while preserving meaningful relationships. It’s particularly useful when the data is assumed to lie on a lower-dimensional manifold embedded in a higher-dimensional space, making it easier to visualize and analyze complex datasets.
Matrix factorization: Matrix factorization is a mathematical technique used to decompose a matrix into the product of two or more lower-dimensional matrices. This process is widely applied in data analysis, particularly in dimensionality reduction, where it helps uncover latent structures within the data, making it easier to analyze and visualize high-dimensional datasets beyond traditional methods like PCA.
Non-linear mapping: Non-linear mapping refers to the transformation of data points from one space to another using non-linear functions, allowing for complex relationships to be captured. This approach is particularly useful in scenarios where linear techniques fail to adequately represent the underlying structure of the data, enabling more effective modeling and analysis. Non-linear mapping plays a crucial role in various dimensionality reduction techniques that extend beyond traditional methods like PCA.
Non-negative matrix factorization: Non-negative matrix factorization (NMF) is a mathematical technique used to decompose a non-negative matrix into two lower-dimensional non-negative matrices. This process allows for the discovery of hidden patterns or features within the data, making it particularly useful for dimensionality reduction and feature extraction in various applications like image processing and text mining.
Reconstruction Error: Reconstruction error refers to the difference between the original data and its approximation after it has been transformed and then reconstructed, often used in dimensionality reduction techniques. This error serves as a measure of how well a model can capture the essential features of the data while reducing its complexity. A lower reconstruction error indicates a more accurate representation of the data in a reduced dimensional space, making it crucial for assessing the effectiveness of various techniques beyond PCA.
Silhouette Score: The silhouette score is a metric used to evaluate the quality of clustering by measuring how similar an object is to its own cluster compared to other clusters. It ranges from -1 to 1, where a high value indicates that points are well-clustered and distinct from other clusters, making it a valuable tool in assessing the effectiveness of different clustering methods.
T-SNE: t-SNE, or t-distributed Stochastic Neighbor Embedding, is a non-linear dimensionality reduction technique that is particularly effective for visualizing high-dimensional data in a lower-dimensional space. It focuses on preserving local structures by modeling similarities between data points as probabilities, which allows it to create compelling visual representations of complex datasets without losing important relationships.
UMAP: UMAP, or Uniform Manifold Approximation and Projection, is a non-linear dimensionality reduction technique that aims to preserve the global structure of data while also maintaining its local relationships. This method is especially effective for visualizing high-dimensional data in lower dimensions, typically 2D or 3D, and has gained popularity for its ability to outperform other techniques like t-SNE in terms of speed and scalability. UMAP relies on manifold learning concepts and has applications in various fields, such as bioinformatics, image analysis, and natural language processing.
Visualization: Visualization is the process of representing data or information in a visual context, such as charts, graphs, and maps, to make it easier to understand patterns, trends, and insights. This technique plays a crucial role in data analysis and interpretation, allowing for the simplification of complex datasets and facilitating better decision-making. It enhances the ability to communicate findings effectively and aids in discovering relationships that might not be evident in raw data.
© 2024 Fiveable Inc. All rights reserved.
AP® and SAT® are trademarks registered by the College Board, which is not affiliated with, and does not endorse this website.