Government and institutional databases are goldmines for journalists. They contain vast amounts of data on everything from population demographics to campaign finances. Learning to navigate and analyze these resources is crucial for uncovering stories and supporting reporting with hard facts.

SQL and data cleaning techniques help journalists extract meaningful insights from complex datasets. Open data portals, tools, and spreadsheet analysis empower reporters to transform raw information into compelling narratives that inform the public and hold power to account.

Databases and SQL

Database Management Systems and SQL

Top images from around the web for Database Management Systems and SQL
  • Database management systems organize and store large amounts of structured data
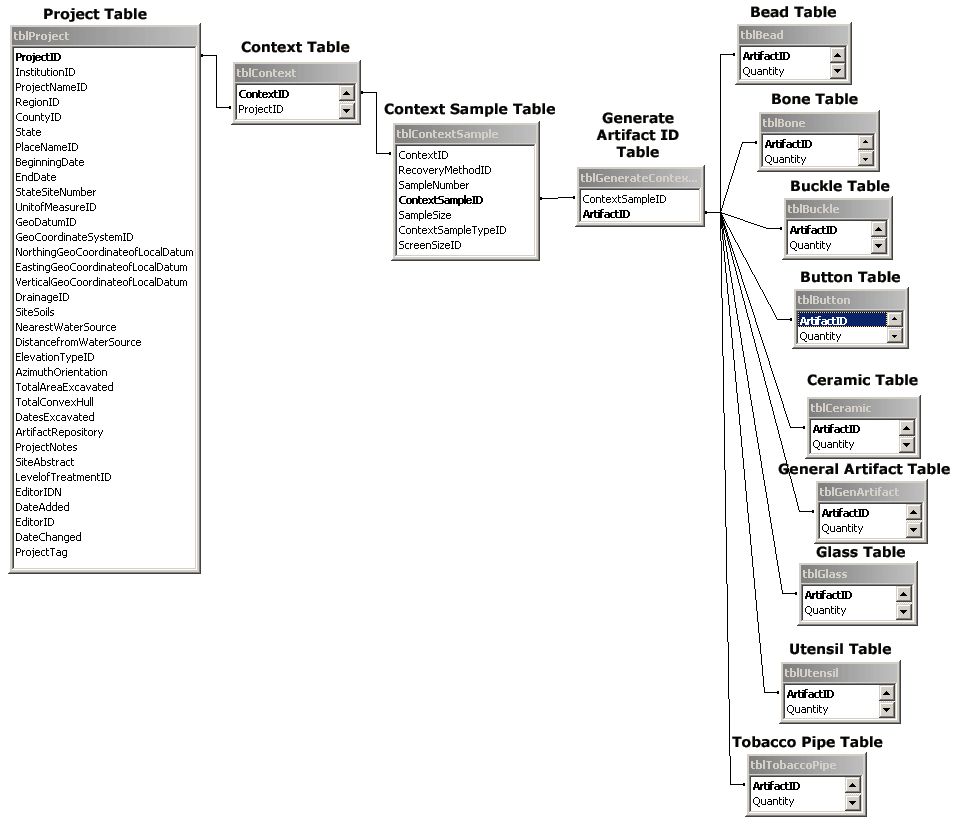
  • Relational databases use tables with rows and columns to represent data entities and relationships
  • SQL (Structured Query Language) allows users to interact with relational databases
  • SQL commands include SELECT, INSERT, UPDATE, and DELETE for manipulating data
  • Queries retrieve specific data subsets based on specified criteria
  • Joins combine data from multiple tables based on related columns

Data Cleaning and Open Data Portals

  • Data cleaning involves identifying and correcting errors or inconsistencies in datasets
  • Common data cleaning tasks include removing duplicates, standardizing formats, and handling missing values
  • Open data portals provide public access to government and institutional datasets
  • Data.gov serves as the U.S. federal government's open data portal
  • Open data initiatives promote transparency and enable innovative analysis by researchers and citizens

Data Analysis Techniques

Data Mining and Visualization

  • extracts patterns and insights from large datasets
  • Techniques include classification, clustering, and association rule learning
  • Data visualization transforms complex data into graphical representations
  • Visualizations help identify trends, patterns, and outliers in data
  • Common visualization types include bar charts, line graphs, scatter plots, and heat maps
  • Tools like Tableau and D3.js enable creation of interactive data visualizations

Spreadsheet Analysis and Pivot Tables

  • Spreadsheet software (Microsoft Excel, Google Sheets) enables data organization and analysis
  • Functions and formulas perform calculations and manipulate data
  • Sorting and filtering help organize and find specific data points
  • Pivot tables summarize large datasets by aggregating and cross-tabulating information
  • Pivot tables allow users to quickly analyze data from different perspectives
  • Charts and graphs can be created directly from pivot table data for visual representation

Government and Institutional Data Sources

Census Data and Its Applications

  • U.S. Census Bureau collects demographic, economic, and social data about the population
  • Decennial Census provides a complete count of the population every 10 years
  • American Community Survey (ACS) offers more frequent, detailed estimates of population characteristics
  • informs policy decisions, resource allocation, and academic research
  • Journalists use census data to provide context and support data-driven storytelling

Campaign Finance Databases and Transparency

  • Federal Election Commission (FEC) maintains databases of campaign contributions and expenditures
  • State-level databases track financing for local and state-level campaigns
  • Campaign finance data reveals sources of political funding and potential conflicts of interest
  • Tools like OpenSecrets.org aggregate and analyze campaign finance data for public consumption
  • Investigative journalists use these databases to uncover patterns in political spending and influence

Key Terms to Review (18)

Ben Welsh: Ben Welsh is a prominent figure in the field of data journalism and open data advocacy, known for his work in enhancing transparency and accountability through the analysis of government and institutional databases. He has played a significant role in promoting data-driven storytelling, encouraging journalists to leverage data to uncover important stories and engage the public.
Census data: Census data refers to the comprehensive collection of demographic, social, economic, and housing information obtained from a population at regular intervals, typically conducted every ten years. This data is crucial for understanding population characteristics, informing policy decisions, and allocating resources in various sectors, including government, healthcare, and education.
Criminal justice databases: Criminal justice databases are organized collections of data that store and manage information related to criminal justice, including criminal records, arrest data, court cases, and law enforcement activities. These databases facilitate the efficient retrieval of critical information for law enforcement agencies, legal professionals, and researchers, playing a vital role in crime analysis and prevention.
Data accessibility: Data accessibility refers to the ease with which users can obtain and utilize data from various sources, ensuring that information is available to those who need it for analysis and decision-making. This concept is crucial in promoting transparency and accountability, especially when dealing with government and institutional databases that contain important public information.
Data bias: Data bias refers to systematic errors in data collection, analysis, interpretation, or presentation that lead to inaccurate conclusions or representations. It can stem from various factors, including how data is gathered, who is included in the dataset, and the methods used for analysis, ultimately skewing the results and influencing decisions based on flawed information.
Data lag: Data lag refers to the delay between the time data is collected and when it becomes available for analysis or use. This delay can impact decision-making, especially in rapidly changing environments where timely information is crucial for understanding trends and making informed choices.
Data mining: Data mining is the process of discovering patterns and extracting valuable information from large sets of data using various analytical techniques. It plays a crucial role in journalism by helping researchers and journalists uncover trends, insights, and stories hidden within vast amounts of data, thus enhancing the overall quality of reporting and analysis.
Data privacy: Data privacy refers to the proper handling, processing, storage, and protection of personal information that individuals share online or in other contexts. It emphasizes the importance of safeguarding sensitive data against unauthorized access, breaches, and misuse, while ensuring compliance with legal regulations and respecting individual rights. This concept is crucial in understanding how government databases are managed, the ethics of data journalism practices, and the implications of big data on individuals' privacy rights.
Data visualization: Data visualization is the graphical representation of information and data, allowing complex data sets to be understood and communicated more easily. It combines elements of design, technology, and storytelling to present data in a way that helps audiences quickly grasp insights, trends, and patterns.
Foia requests: FOIA requests, or Freedom of Information Act requests, are formal petitions made by individuals or organizations to obtain access to records held by government agencies. This process is crucial for promoting transparency and accountability within the government, as it allows journalists and the public to access information that may reveal insights into government actions, decisions, and spending.
Informed Consent: Informed consent is the process by which researchers ensure that participants are fully aware of the nature, risks, and benefits of a study before agreeing to participate. This concept is crucial in research ethics, ensuring that individuals can make knowledgeable decisions about their involvement, thus promoting transparency and respect for autonomy.
Open Government Data: Open government data refers to the information generated and held by government entities that is made available to the public in a format that is easily accessible and usable. This concept promotes transparency, accountability, and civic engagement by allowing citizens to access data that can inform their understanding of government operations and decisions. Open government data encompasses various datasets, including statistics, research findings, and other relevant information related to public services and governance.
Peer Review: Peer review is a process in which scholarly work, such as research articles or proposals, is evaluated by experts in the same field before publication or funding. This process helps ensure the quality, validity, and reliability of the research by providing constructive feedback from qualified individuals, enhancing the credibility of the findings and the authors. It plays a crucial role in maintaining standards within academic publishing and can influence how research plans are developed, how government and institutional data is analyzed, and how source credibility is assessed.
ProPublica: ProPublica is a nonprofit investigative journalism organization that aims to produce in-depth news reports and hold powerful institutions accountable. It specializes in using data journalism to uncover stories that are often overlooked by traditional media, making government and institutional databases a central focus of its investigative work.
Public records: Public records are documents or pieces of information that are not considered confidential and are maintained by government agencies or public authorities. They include a wide range of data such as court records, birth and death certificates, property records, and more, and serve as essential tools for transparency and accountability in governance.
Quantitative analysis: Quantitative analysis is a research method that focuses on quantifying data and analyzing it statistically to uncover patterns, relationships, or trends. This approach uses numerical data collected from various sources to make informed conclusions and drive decision-making. In the context of information gathering, it plays a vital role in examining large datasets and providing evidence-based insights, especially when it comes to government transparency, database scrutiny, and addressing biases in research.
Statistical significance: Statistical significance is a mathematical determination that indicates whether the observed results in a study are likely to be genuine or if they could have occurred by random chance. It is typically assessed using a p-value, which helps researchers understand if the findings from their data analysis are reliable enough to draw conclusions. Establishing statistical significance is crucial for validating claims based on research and understanding the real-world implications of data.
Triangulation: Triangulation is a method used in research to cross-verify information by using multiple sources or methods to ensure accuracy and credibility. This approach is crucial for enhancing the reliability of findings, as it allows researchers to compare different data points and perspectives, thereby painting a more comprehensive picture of the subject under investigation.
© 2024 Fiveable Inc. All rights reserved.
AP® and SAT® are trademarks registered by the College Board, which is not affiliated with, and does not endorse this website.