Confidence intervals for proportions help estimate population values based on sample data. They provide a range of likely values for the true proportion, considering sample size and desired confidence level. This powerful tool allows businesses to make informed decisions.

To use confidence intervals effectively, certain conditions must be met. These include random sampling, large enough sample sizes, and proper . Understanding these concepts enables more accurate analysis and better decision-making in various business scenarios.

Confidence Intervals for Proportions

Confidence intervals for population proportions

Top images from around the web for Confidence intervals for population proportions
  • Calculate confidence intervals for population proportions using the approximation
  • Formula: p^±zα/2p^(1p^)n\hat{p} \pm z_{\alpha/2} \sqrt{\frac{\hat{p}(1-\hat{p})}{n}}
    • p^\hat{p} represents the (percentage of successes in the sample)
    • zα/2z_{\alpha/2} 
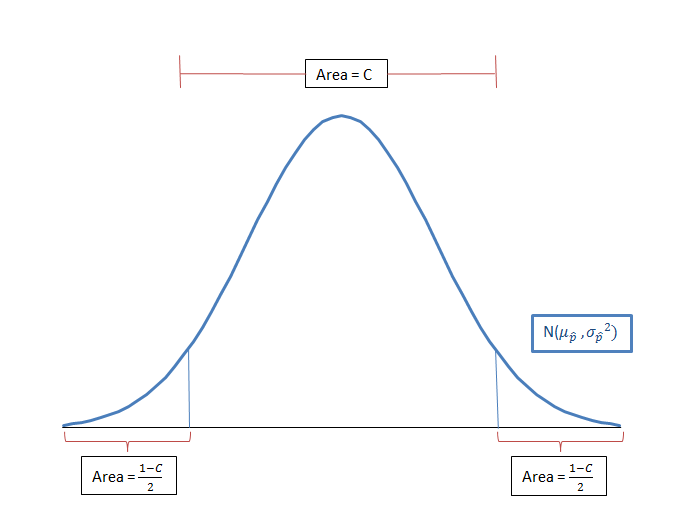
is the critical value from the standard normal distribution based on the desired confidence level
      • α\alpha is the significance level, and α/2\alpha/2 is used for two-sided confidence intervals (90%, 95%, 99%)
    • nn is the sample size (number of observations in the sample)
  • Provides a range of plausible values for the true population proportion based on sample data

Conditions for normal distribution approximation

  • Verify conditions for using the normal distribution approximation to construct confidence intervals for proportions
    1. Random and independent sample selection ensures unbiased representation of the population
    2. Large enough sample size satisfies the following criteria:
      • np^10n\hat{p} \geq 10 and n(1p^)10n(1-\hat{p}) \geq 10
      • Ensures the sampling distribution of the sample proportion is approximately normal (central limit theorem)
  • Meeting these conditions allows for accurate approximation and reliable confidence intervals

Margin of error for proportion intervals

  • Calculate the to determine the precision of the confidence interval estimate
  • Formula: Margin of error = zα/2p^(1p^)nz_{\alpha/2} \sqrt{\frac{\hat{p}(1-\hat{p})}{n}}
    • Represents the range of values above and below the sample proportion where the true population proportion likely falls
    • Smaller margin of error indicates higher precision and narrower confidence interval
    • Larger sample sizes decrease the margin of error, holding other factors constant (confidence level, sample proportion)
  • Quantifies the uncertainty associated with the confidence interval estimate

Interpretation of proportion confidence intervals

  • Interpret the meaning and implications of a confidence interval for a population proportion in a business context
  • Example: 95% confidence interval for the proportion of defective products (0.03, 0.07)
    • 95% confidence that the true proportion of defective products in the population falls between 3% and 7%
    • Repeated sampling would result in 95% of the confidence intervals containing the true population proportion
  • Narrower intervals indicate more precise estimates, while wider intervals suggest less precision
  • Higher confidence levels (99%) yield wider intervals, while lower confidence levels (90%) produce narrower intervals
  • Confidence level represents the long-run probability of the interval containing the true population proportion
  • Use confidence intervals to make data-driven business decisions and assess the reliability of sample estimates

Key Terms to Review (18)

Alternative Hypothesis: The alternative hypothesis is a statement that contradicts the null hypothesis, suggesting that there is an effect, a difference, or a relationship in the population. It serves as the focus of research, aiming to provide evidence that supports its claim over the null hypothesis through statistical testing and analysis.
Binary outcomes: Binary outcomes refer to situations or experiments where there are only two possible results. These results can be classified as 'success' or 'failure', 'yes' or 'no', and they form the basis of many statistical analyses, particularly in understanding proportions. The simplicity of binary outcomes makes them foundational for constructing confidence intervals, where the focus is on estimating the proportion of successes in a population based on sample data.
Categorical data: Categorical data refers to a type of data that can be divided into distinct groups or categories, which are often qualitative in nature. This type of data is used to classify items into various categories based on attributes or characteristics, and it does not have a numerical value associated with it. Categorical data can be further divided into nominal and ordinal types, making it essential for various statistical analyses and graphical representations.
Confidence interval for proportions: A confidence interval for proportions is a statistical range that estimates the true proportion of a population based on sample data, allowing for uncertainty in the estimate. This interval is calculated using the sample proportion, the size of the sample, and a critical value from the standard normal distribution, reflecting how confident we are that the true population proportion lies within this range.
Confidence Level Formula: The confidence level formula is a statistical equation that helps determine the degree of certainty or confidence associated with a given confidence interval for population parameters. It is commonly expressed as a percentage, indicating how confident one can be that the population parameter lies within the specified range, often referred to as the margin of error. This concept is essential when analyzing proportions, as it provides insight into the reliability of the data collected and the inferences made from it.
Customer satisfaction estimation: Customer satisfaction estimation refers to the process of quantifying how satisfied customers are with a product or service. This estimation helps businesses understand customer experiences, identify areas for improvement, and make informed decisions based on statistical analysis of customer feedback.
Decision-making based on intervals: Decision-making based on intervals involves using statistical ranges, particularly confidence intervals, to make informed choices or predictions regarding population parameters. This method allows individuals or businesses to quantify uncertainty and assess the reliability of estimates, guiding strategic decisions with a clearer understanding of potential outcomes.
Interpretation of Results: Interpretation of results refers to the process of making sense of statistical findings, particularly how they relate to the context of a study. This involves understanding the implications of the data, determining the significance of the findings, and assessing how they align with or challenge existing theories or assumptions. In the case of confidence intervals for proportions, interpretation helps in understanding the reliability of the estimated proportion and what it tells us about the population from which a sample was drawn.
Level of confidence: The level of confidence is a statistical measure that reflects the degree of certainty associated with an estimate derived from sample data. It is commonly expressed as a percentage, indicating the likelihood that the population parameter lies within a specified confidence interval. A higher level of confidence corresponds to a wider interval, allowing for greater assurance that the true parameter falls within that range.
Margin of error: The margin of error is a statistic that expresses the amount of random sampling error in a survey's results. It provides an estimate of the uncertainty around a sample statistic, helping to convey how much the results may differ from the true population value. This concept is crucial when interpreting data, as it indicates the range within which the true value is likely to fall and connects closely to confidence levels and sample size.
Market Research Analysis: Market research analysis is the process of gathering, analyzing, and interpreting information about a market, including information about the target audience, competitors, and the industry as a whole. This analysis helps businesses make informed decisions regarding product development, marketing strategies, and overall business planning. By utilizing various statistical methods, organizations can identify trends and correlations that shape consumer behavior and preferences.
Normal distribution: Normal distribution is a probability distribution that is symmetric about the mean, showing that data near the mean are more frequent in occurrence than data far from the mean. This characteristic forms a bell-shaped curve, which is significant in various statistical methods and analyses.
Null hypothesis: The null hypothesis is a statement that assumes there is no effect or no difference in a given situation, serving as a default position that researchers aim to test against. It acts as a baseline to compare with the alternative hypothesis, which posits that there is an effect or a difference. This concept is foundational in statistical analysis and hypothesis testing, guiding researchers in determining whether observed data can be attributed to chance or if they suggest significant effects.
Point Estimate: A point estimate is a single value derived from sample data that serves as a best guess or approximation of an unknown population parameter. It represents the most likely value for a characteristic of the population, such as the mean or proportion, based on observed data. Point estimates are essential for making inferences about populations, often being the starting point for constructing confidence intervals that provide a range of plausible values for the parameter.
Sample proportion: Sample proportion is the ratio of a specific outcome of interest to the total number of observations in a sample, usually denoted as \( \hat{p} \). It serves as a key measure in statistical analysis to estimate the true population proportion and plays a vital role in constructing confidence intervals and conducting hypothesis tests.
Sample size determination: Sample size determination is the process of calculating the number of observations or replicates needed in a study to ensure that the results will be statistically significant and reflective of the population. This concept is crucial because an appropriately chosen sample size helps to achieve a desired level of confidence in estimates, whether for means or proportions, and aids in effective quality control. Proper sample size determination helps balance accuracy and resource constraints while minimizing errors.
Statistical Significance: Statistical significance refers to the likelihood that a relationship or difference observed in data is not due to random chance. It indicates that the results of a study are reliable and can be generalized to a larger population, helping researchers draw meaningful conclusions from their analyses.
Z-score formula: The z-score formula is a mathematical equation used to determine the number of standard deviations a data point is from the mean of a dataset. This standardized score helps in understanding how far away an observation is relative to the average and is crucial for calculating probabilities and making statistical inferences, especially when working with proportions and normal distributions.
© 2024 Fiveable Inc. All rights reserved.
AP® and SAT® are trademarks registered by the College Board, which is not affiliated with, and does not endorse this website.