and are powerful tools for organizing thoughts and boosting creativity. They help you see connections between ideas, making complex topics easier to understand. By using colors, images, and spatial arrangements, these techniques engage both sides of your brain.

These visual thinking methods are great for learning, problem-solving, and productivity. They can improve memory retention, speed up learning, and make planning more efficient. Whether you're studying for an exam or brainstorming for a project, mind maps and concept visualizations can give you a clearer picture of your ideas.

Mind Mapping Principles and Benefits

Components and Structure

Top images from around the web for Components and Structure
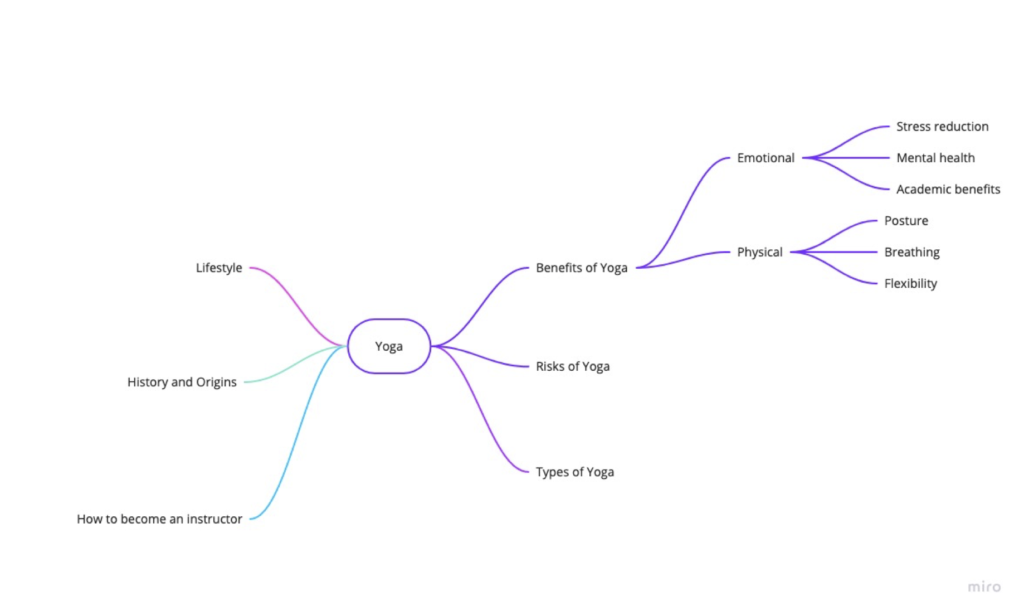
  • Mind mapping is a visual thinking tool that helps structure information by organizing and representing ideas and concepts in a radial, graphical, non-linear manner
  • The main components of a mind map include:
    • A central topic that represents the main focus or theme
    • Main themes radiating from the central topic, serving as key categories or subtopics
    • Branches with key words, phrases, or images that expand on each main theme
    • Connections between concepts, showing relationships and associations

Cognitive Engagement and Stimulation

  • Mind maps engage both hemispheres of the brain by using a combination of elements:
    • Words and phrases to convey logical and analytical thinking (left hemisphere)
    • Images, colors, and visual-spatial arrangement to stimulate creativity and imagination (right hemisphere)
  • This dual engagement enhances cognitive associations, making information more memorable and easier to recall

Benefits for Learning and Productivity

  • Mind mapping offers several benefits for learning, memory, and productivity:
    • Improved memory retention by combining visual and verbal information
    • Enhanced creativity through the use of colors, images, and free-flowing structure
    • Better organization and planning by breaking down complex topics into manageable chunks
    • Faster learning by presenting information in a concise and interconnected format
    • More efficient problem-solving by visualizing relationships and potential solutions
  • Concept visualization through mind mapping allows for a holistic understanding of a subject, making it easier to identify relationships, patterns, and gaps in knowledge

Mind Mapping Techniques for Idea Organization

Creating the Mind Map Structure

  • Start by defining a central topic or question and placing it in the center of the mind map, typically within an image that represents the subject (e.g., a lightbulb for "Innovative Ideas")
  • Create main branches radiating outwards from the central topic, using different colors or thicknesses to categorize and prioritize ideas (e.g., red for urgent tasks, green for long-term goals)
  • Add sub-branches to further develop and explore each main theme, using keywords, images, or symbols to represent specific concepts or ideas (e.g., a dollar sign for financial considerations)

Enhancing Visual Appeal and Clarity

  • Utilize curved, organic lines to connect related branches and sub-branches, creating a natural flow and hierarchy of information
  • Encourage brainstorming and free by adding new ideas and concepts as they arise, without worrying about structure or organization
  • Refine the mind map by rearranging branches, adding or removing elements, and ensuring clarity and visual appeal (e.g., adjusting colors, font sizes, or spacing for better readability)

Concept Map Creation and Design

Visual Hierarchy and Organization

  • Use a clear and consistent to organize information, with the most important ideas or concepts given prominence through size, color, or position
  • Employ a limited color palette to categorize and group related ideas, enhancing the map's readability and aesthetic appeal (e.g., blue for main themes, green for sub-topics)
  • Incorporate images, icons, and symbols to represent key concepts, engaging visual memory and making the mind map more memorable (e.g., a graduation cap for education-related topics)

Customization and Personalization

  • Utilize white space effectively to avoid clutter and ensure a balanced, visually pleasing layout
  • Experiment with different mind mapping styles, such as spider diagrams, tree diagrams, or flowcharts, depending on the nature of the information and personal preferences
  • Create a legend or key to explain any symbols, colors, or abbreviations used in the mind map, ensuring clarity for others who may view it

Concept Visualization for Learning and Problem Solving

Enhancing Learning and Memory

  • Apply mind mapping to summarize and review key information from lectures, reading materials, or personal notes, reinforcing understanding and memory retention
  • Use concept maps to prepare for exams or presentations by organizing and prioritizing key facts, ideas, and arguments
  • Integrate mind mapping with other learning strategies, such as note-taking, active recall, or spaced repetition, to create a comprehensive and effective learning approach (e.g., using mind maps to identify key concepts for flashcard creation)

Problem-Solving and Collaboration

  • Employ mind maps to break down complex problems into manageable components, visualizing relationships and potential solutions
  • Encourage collaborative mind mapping in group settings to brainstorm ideas, plan projects, or solve problems collectively (e.g., using online mind mapping tools for remote teamwork)
  • Regularly review and update mind maps to consolidate new knowledge, identify gaps in understanding, and maintain a fresh perspective on the subject matter

Key Terms to Review (19)

Association: Association refers to the mental connection between ideas, concepts, or images, enabling individuals to link new information with prior knowledge. This process is crucial in enhancing understanding and retention, as it allows for the organization of thoughts in a meaningful way. By creating associations, one can visualize relationships and hierarchies among concepts, which aids in problem-solving and idea generation.
Branching: Branching refers to the process of creating a visual representation that connects ideas or concepts in a hierarchical structure, often used in mind mapping and concept visualization. This method allows for the exploration of relationships and connections between different pieces of information, enhancing understanding and retention. By organizing thoughts into branches, it becomes easier to navigate complex topics and visualize how ideas relate to one another.
Chart: A chart is a visual representation of data or information designed to simplify complex data sets, making them easier to understand and analyze. Charts can take various forms, such as bar graphs, pie charts, line graphs, or flowcharts, each serving different purposes in illustrating relationships, trends, or structures within the data. By employing charts in mind mapping and concept visualization, individuals can effectively organize their thoughts and convey information more clearly.
Color coding: Color coding is a visual technique that uses different colors to organize information, making it easier to identify relationships, categorize concepts, and enhance memory retention. By associating specific colors with particular themes or categories, individuals can quickly distinguish between various elements within visual aids like mind maps and diagrams. This method not only improves clarity but also supports cognitive processes by leveraging color perception.
Concept visualization: Concept visualization is the process of creating visual representations of ideas, concepts, and information to enhance understanding and communication. This technique leverages diagrams, charts, and other graphic tools to organize thoughts and represent relationships between various elements, making complex information easier to digest and remember.
Enhanced memory: Enhanced memory refers to the improved ability to encode, store, and retrieve information effectively, often achieved through various techniques that engage visual thinking. This concept is particularly important as it emphasizes how visual tools can aid in better understanding and recalling information, enabling deeper cognitive processing and retention.
Graphic organizers: Graphic organizers are visual representations that help organize and structure information, making it easier to understand and analyze concepts. They can take various forms, such as mind maps, flowcharts, and Venn diagrams, enabling individuals to visualize relationships between ideas and facilitate deeper comprehension. These tools are widely used in both educational settings and training environments to enhance learning through visual communication.
Iconography: Iconography refers to the visual imagery and symbols used in art and other forms of visual representation to convey particular meanings and themes. It plays a crucial role in understanding cultural narratives, as different cultures can imbue specific symbols with unique interpretations and significance, influencing how viewers perceive visual content.
Improved Comprehension: Improved comprehension refers to the enhancement of understanding and retention of information through various visual techniques. This concept is especially relevant when engaging with tools like mind maps and concept visualizations, which can clarify complex ideas, illustrate relationships between concepts, and make information more accessible and memorable.
Infographic: An infographic is a visual representation of information, data, or knowledge designed to present complex information quickly and clearly. Infographics combine graphic design with data visualization to help convey messages effectively, making them particularly useful for simplifying dense material and enhancing understanding. They can incorporate various elements such as charts, icons, images, and text to create a cohesive narrative that guides the viewer through the information.
Layering: Layering refers to the technique of organizing information or visual elements in a way that distinguishes them based on their importance or context. This method helps create depth and clarity in mind maps and concept visualizations, allowing viewers to easily navigate complex ideas by separating them into manageable segments while showing the relationships among those segments.
Mind Mapping: Mind mapping is a visual technique used to organize information hierarchically, illustrating relationships among concepts through a diagram that connects ideas around a central theme. This approach enhances understanding, creativity, and retention by visually representing complex ideas, making it easier to brainstorm, solve problems, and innovate.
MindMeister: MindMeister is an online mind mapping tool that enables users to create, share, and collaborate on visual representations of ideas and concepts. By allowing the visualization of thoughts in a structured manner, MindMeister supports brainstorming, project planning, and organizing information, making it a valuable resource for enhancing understanding and retention.
Prototype: A prototype is an early model or version of a product, concept, or idea used to test and validate its functionality and design before full-scale production or implementation. Prototypes allow for exploration and refinement, providing a tangible representation that can be evaluated and iterated upon based on feedback. They serve as essential tools in visual thinking and design processes, enabling designers to visualize concepts and improve user experiences.
Spider diagram: A spider diagram is a visual tool used to represent ideas or concepts in a non-linear format, with a central idea at the center and branches radiating out to related topics. This format helps to illustrate connections between ideas, making it easier to understand complex information and foster creative thinking. Spider diagrams are effective for brainstorming, organizing thoughts, and visually mapping out relationships between different concepts.
User-Centered Design: User-centered design is an approach that focuses on understanding the needs, preferences, and limitations of end-users at every stage of the design process. This method ensures that products and services are tailored to meet user requirements, resulting in more effective and satisfying interactions. By prioritizing users' perspectives, this design philosophy enhances usability, encourages effective communication, and fosters better engagement through visual representations.
Visual Hierarchy: Visual hierarchy is the arrangement of elements in a design that signifies their importance, guiding the viewer's eye and helping them understand the content's structure. By using size, color, contrast, and placement, designers can prioritize information and lead audiences through a visual experience effectively.
Visual metaphor: A visual metaphor is a representation that connects one idea or concept to another through imagery, using visual elements to create associations that evoke understanding or emotion. This technique allows for deeper communication by portraying complex concepts in a more relatable and engaging manner, often making abstract ideas easier to grasp.
Xmind: Xmind is a popular mind mapping and brainstorming software that helps users visualize their thoughts, ideas, and concepts in an organized way. It provides a flexible platform to create diagrams that can enhance understanding, retention, and communication of complex information, making it a valuable tool for visual thinking and concept visualization.
© 2024 Fiveable Inc. All rights reserved.
AP® and SAT® are trademarks registered by the College Board, which is not affiliated with, and does not endorse this website.