15.4 Exploratory data analysis

3 min readjune 24, 2024

is a crucial step in understanding datasets. It involves examining data structure, uncovering patterns, and generating insights. EDA helps identify data quality issues and guides further analysis.

In Python, EDA techniques include data retrieval, filtering, and handling missing values. These methods allow you to select, subset, and clean data effectively. Visualization and statistical analysis further enhance your understanding of the dataset's characteristics and relationships.

Introduction to Exploratory Data Analysis (EDA)

Purpose of exploratory data analysis

Top images from around the web for Purpose of exploratory data analysis
  • Gain deep understanding of dataset by examining its structure, dimensions, and data types
  • Uncover hidden patterns, relationships, and anomalies within the data (correlations, trends)
  • Generate valuable insights and hypotheses to guide further analysis and decision-making
  • Identify data quality issues and preprocess data for subsequent modeling or analysis

Data retrieval with indexing

  • Select single column using square brackets and column name
    df['age']
  • Select multiple columns using list of column names
    df[['name', 'age', 'city']]
  • Access single column as attribute using dot notation
    df.age
  • Use
    [loc[]](https://www.fiveableKeyTerm:loc[])
    for label-based indexing to select rows and columns by their labels
    df.loc[2:5, 'name':'age']
  • Use
    [iloc[]](https://www.fiveableKeyTerm:iloc[])
    for integer-based indexing to select rows and columns by their integer positions
    df.iloc[1:4, 2:5]

Filtering and slicing for subsets

  • Create boolean mask based on condition and use it to filter rows
    filtered_df = df[df['age'] > 18]
  • Select range of rows by integer positions using slicing
    df[2:6]
  • Select range of rows by labels using
    loc[]
    df.loc['2022-01-01':'2022-01-07']
  • Filter rows using
    query()
    method with boolean expression as string
    filtered_df = df.query('age > 18 & city == "New York"')
  • Combine multiple conditions using boolean operators
    &
    for AND and
    |
    for OR
    filtered_df = df[(df['age'] > 18) & (df['city'] == 'New York')]

Detection of missing values

  • Use
    [isnull()](https://www.fiveableKeyTerm:isnull())
    or
    [isna()](https://www.fiveableKeyTerm:isna())
    to create boolean mask indicating missing values
    df.isnull()
  • Count missing values in each column using
    sum()
    df.isnull().sum()
  • Missing values reduce sample size, lead to biased or inaccurate results, and pose challenges for machine learning
  • Identify type of missingness:
    1. Missing completely at random (MCAR) values are independent of other variables
    2. Missing at random (MAR) values depend on observed variables
    3. Missing not at random (MNAR) values depend on unobserved variables

Strategies for handling null data

  • Remove rows with missing values using
    [dropna()](https://www.fiveableKeyTerm:dropna())
    df.dropna()
  • Remove columns with missing values using
    dropna()
    with
    axis=1
    df.dropna(axis=1)
  • Fill missing values with specific value using
    [fillna()](https://www.fiveableKeyTerm:fillna())
    df.fillna(0)
  • Fill missing values with mean or median of column:
    • Mean
      df.fillna(df.mean())
    • Median imputation
      df.fillna(df.median())
  • Forward or backward fill missing values using
    [ffill()](https://www.fiveableKeyTerm:ffill())
    or
    [bfill()](https://www.fiveableKeyTerm:bfill())
    df.fillna(method='ffill')
  • Impute missing values using advanced techniques (k-Nearest Neighbors, models)
  • techniques help address missing values and improve data quality

Exploratory Analysis Techniques

  • provide summary measures of central tendency, dispersion, and shape of data distribution
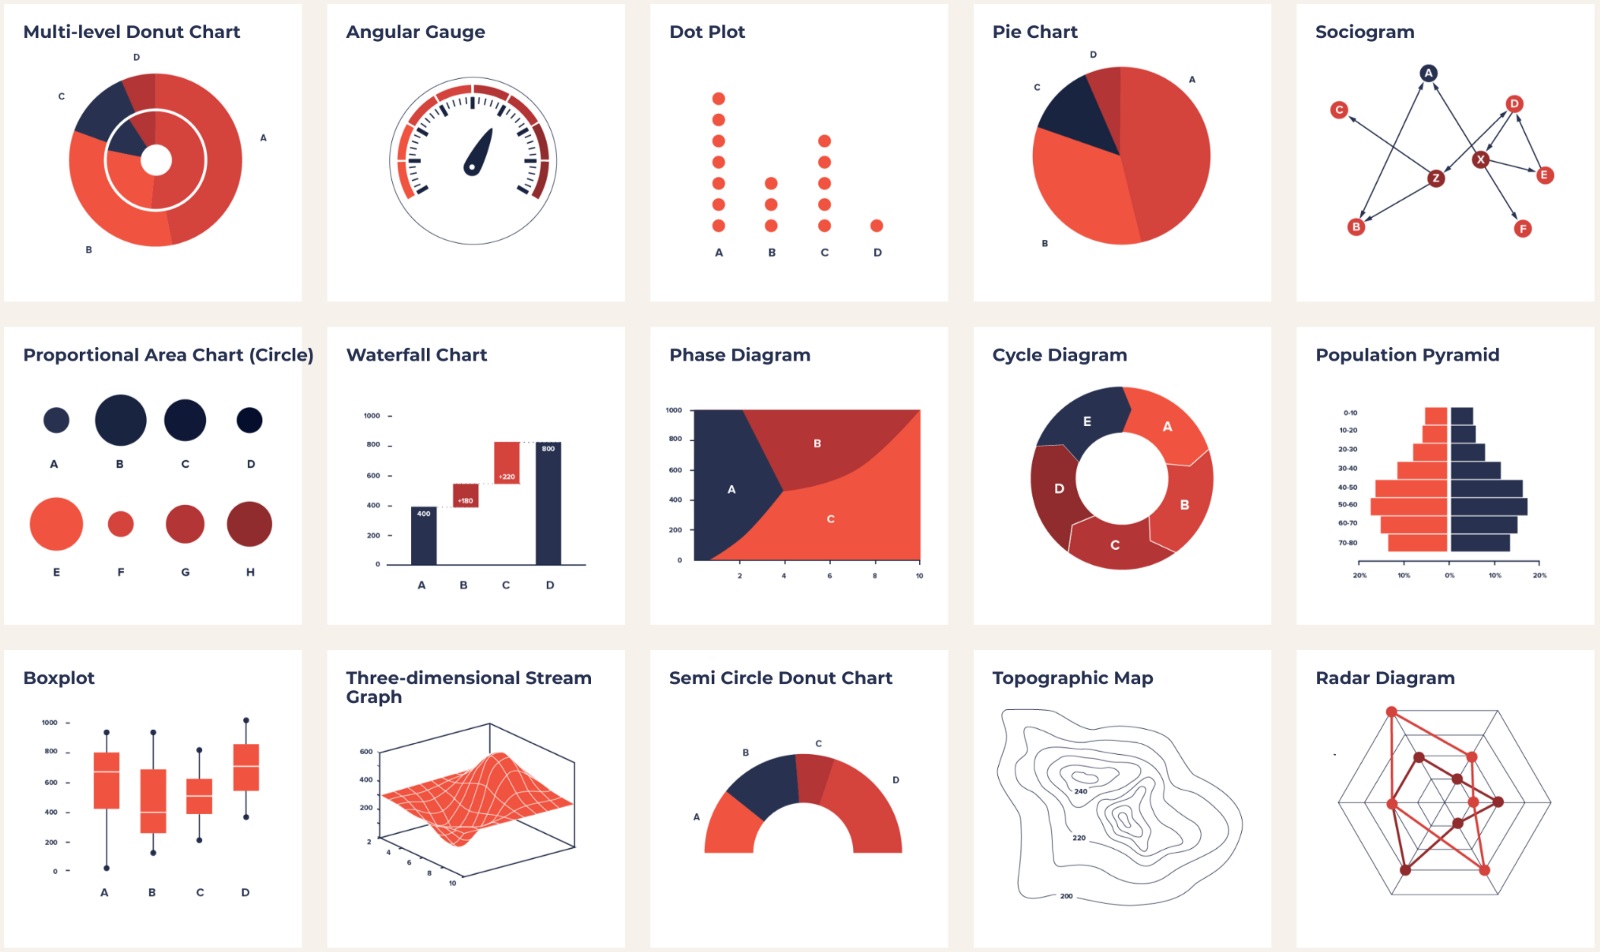
  • techniques help identify patterns, trends, and outliers in the data
  • examines the distribution of a single variable
  • explores relationships between two variables
  • investigates interactions among three or more variables
  • (e.g., histograms, scatter plots, box plots) offer visual insights into data characteristics

Key Terms to Review (44)

Bfill(): The bfill() method in Python's pandas library is a data filling technique used in the context of exploratory data analysis. It is a backward-fill operation that replaces missing values in a dataset by propagating the last valid observation forward to the next valid value.
Bivariate Analysis: Bivariate analysis is the statistical examination of the relationship between two variables. It explores how changes in one variable are associated with changes in another variable, providing insights into the nature and strength of their relationship.
Categorical: Categorical refers to a variable or data that can be divided into distinct groups or categories based on qualitative characteristics, rather than quantitative measurements. This type of data is commonly used in data analysis and visualization.
Correlation: Correlation is a statistical measure that describes the degree and direction of the linear relationship between two variables. It quantifies the strength and direction of the association between variables, allowing researchers to understand patterns and make predictions.
Data cleaning: Data cleaning is the process of identifying and correcting inaccuracies or inconsistencies in data to improve its quality. This step is crucial for ensuring that analyses yield reliable results, as clean data helps avoid misinterpretations and enhances the overall integrity of data-driven insights. Effective data cleaning involves removing duplicates, handling missing values, and correcting errors in formatting or entry.
Data Visualization: Data visualization is the graphical representation of information and data. It involves the creation of charts, graphs, and other visual tools to effectively communicate complex data and insights in a clear and concise manner.
DataFrame: A DataFrame is a two-dimensional, labeled data structure in Python's Pandas library, similar to a spreadsheet or a SQL table. It is a fundamental data structure used in data science and data analysis tasks, providing a flexible and efficient way to store, manipulate, and analyze structured data.
Descriptive Statistics: Descriptive statistics is a branch of statistics that involves the collection, organization, analysis, and presentation of data to describe its key characteristics. It provides a summary of the main features of a dataset, allowing researchers to gain insights without making inferences or drawing conclusions about the larger population.
Dropna(): dropna() is a method in the pandas library used to remove rows or columns with missing data (NaN values) from a DataFrame or Series. It is a crucial tool in exploratory data analysis, as it helps clean and prepare data for further analysis by addressing the presence of missing values.
Exploratory Data Analysis (EDA): Exploratory Data Analysis (EDA) is an approach to analyzing data sets to summarize their main characteristics, often with visual methods. It helps in understanding the structure of data and identifying patterns, anomalies, or relationships.
Exploratory Graphs: Exploratory graphs are visual representations used in the initial stages of data analysis to gain a deeper understanding of the data. They help identify patterns, trends, and relationships within the data, guiding the analyst towards more focused and informed analyses.
Feature Engineering: Feature engineering is the process of selecting, manipulating, and transforming raw data into meaningful features or variables that can be used as inputs for machine learning models. It is a critical step in the data science workflow, as the quality and relevance of the features directly impact the performance of the model.
Ffill(): ffill() is a method in the pandas library used for filling missing values in a DataFrame or Series by propagating the last valid observation forward. It is a powerful tool for exploratory data analysis, as it helps address the issue of missing data, which is a common challenge in working with real-world datasets.
Fillna(): fillna() is a pandas function used to replace missing values (NaN) in a DataFrame or Series with a specified value. It is a crucial tool in the exploratory data analysis process, as it allows researchers to handle and clean missing data, which is a common issue in real-world datasets.
Groupby: Groupby is a powerful data manipulation tool in Pandas, a popular Python library for data analysis and manipulation. It allows you to split a dataset into groups based on one or more criteria, perform calculations on each group, and then aggregate the results. This feature is particularly useful in the context of exploratory data analysis, where identifying patterns and trends within subsets of data is crucial.
Heatmap: A heatmap is a data visualization technique that uses a color-coded system to represent the magnitude or frequency of values in a dataset. It is commonly used to explore and analyze patterns, trends, and relationships within large datasets, particularly in the context of exploratory data analysis and data visualization.
Histogram: A histogram is a graphical representation of the distribution of a dataset. It displays the frequency or count of data points within specified intervals or bins, providing a visual summary of the data's underlying distribution.
Hypothesis Testing: Hypothesis testing is a statistical method used to determine whether a particular claim or hypothesis about a population parameter is likely to be true or false. It involves formulating a null hypothesis and an alternative hypothesis, and then using sample data to evaluate the likelihood of the null hypothesis being true.
Iloc[]: iloc[] is a powerful indexing tool in Python's Pandas library that allows you to select data from a DataFrame or Series based on integer-based (i.e., positional) indexing. It provides a way to access specific rows and columns by their integer position, making it particularly useful for exploratory data analysis.
Imputation: Imputation is the process of estimating and replacing missing values in a dataset, allowing for more complete and accurate analysis. It is a crucial step in exploratory data analysis, as missing data can significantly impact the reliability and validity of the insights derived from the data.
Isna(): The isna() function is a powerful tool in the context of exploratory data analysis. It is used to identify and locate missing or null values within a dataset, which is a crucial step in understanding the quality and completeness of the data being analyzed.
Isnull(): The isnull() function is a SQL and programming language feature that checks if a value is null or not. It is commonly used in exploratory data analysis to identify missing or null values in a dataset, which is a crucial step in understanding and cleaning the data before further analysis.
K-means Clustering: k-means clustering is an unsupervised machine learning algorithm used to group similar data points into k distinct clusters. It aims to partition the data into k clusters in which each data point belongs to the cluster with the nearest mean, serving as a prototype of the cluster.
Lambda Function: A lambda function, also known as an anonymous function, is a small, one-time-use function in programming that can be defined without a name. It is commonly used for concise, functional programming and is particularly useful in the context of exploratory data analysis.
List comprehension: List comprehension is a concise way to create lists in Python using a single line of code. It consists of brackets containing an expression followed by a for clause and optionally, one or more if clauses.
List Comprehension: List comprehension is a concise and efficient way to create new lists in Python by applying a transformation or condition to each element of an existing list. It allows for the creation of lists in a single, compact expression, making code more readable and reducing the need for traditional looping structures.
Loc[]: The loc[] method in Python's Pandas library is a powerful tool used for selecting and accessing data within a DataFrame or Series. It allows for precise, label-based indexing, enabling users to extract specific rows, columns, or elements based on their labels or index values.
Matplotlib: Matplotlib is a comprehensive library for creating static, animated, and interactive visualizations in Python. It provides a wide range of tools and functions for generating high-quality plots, graphs, and charts that can be used in various contexts, including data analysis, scientific research, and data-driven applications.
Merge: Merge is the process of combining or joining two or more datasets, such as tables or dataframes, into a single unified dataset. It allows for the integration and analysis of data from multiple sources, enabling a more comprehensive understanding of the information.
Multivariate Analysis: Multivariate analysis is a statistical approach used to examine and understand the relationships between multiple variables simultaneously. It is a powerful tool for exploring complex datasets and uncovering insights that may not be evident from analyzing individual variables in isolation.
Ndarray: An ndarray, or N-dimensional array, is the fundamental data structure in the NumPy library for Python. It is a multi-dimensional array that can hold elements of the same data type, allowing for efficient storage and manipulation of large datasets.
Normalization: Normalization is the process of organizing data in a database to reduce redundancy, minimize data anomalies, and improve data integrity. It involves restructuring the data model to eliminate repeating groups, ensure data dependencies, and create a more efficient and logical data structure.
Numerical: Numerical refers to the use of numbers, quantities, or data that can be expressed in a quantitative form. It is a fundamental aspect of various fields, including mathematics, science, and data analysis, where numerical information is essential for understanding, modeling, and drawing insights from observed phenomena.
NumPy: NumPy is a powerful open-source library for numerical computing in Python, providing support for large, multi-dimensional arrays and matrices, along with a large collection of high-level mathematical functions to operate on these arrays. It is a fundamental library for scientific computing in Python, and its efficient implementation and use of optimized underlying libraries make it a crucial tool for data analysis, machine learning, and a wide range of scientific and engineering applications.
One-Hot Encoding: One-hot encoding is a technique used to represent categorical variables as binary vectors. It creates a new binary column for each unique category, with a value of 1 in the column corresponding to the category and 0 in all other columns.
Outlier Detection: Outlier detection is the process of identifying data points within a dataset that deviate significantly from the rest of the data. These atypical observations can provide valuable insights and inform decision-making, but they can also skew statistical analyses if not properly handled.
Pandas: Pandas is a powerful open-source Python library used for data manipulation and analysis. It provides high-performance, easy-to-use data structures and data analysis tools, making it a popular choice for working with structured (tabular, multidimensional, potentially heterogeneous) and time series data.
Pivot Table: A pivot table is a powerful data analysis tool that allows users to summarize, analyze, and visualize large amounts of data by transforming it into a concise, interactive report. It is particularly useful for exploratory data analysis, as it enables users to quickly identify patterns, trends, and relationships within complex datasets.
Principal Component Analysis: Principal Component Analysis (PCA) is a statistical technique used to reduce the dimensionality of a dataset by identifying the most significant patterns and trends within the data. It achieves this by transforming the original variables into a new set of uncorrelated variables called principal components, which capture the maximum amount of variance in the data.
Regression: Regression is a statistical technique used to model and analyze the relationship between a dependent variable and one or more independent variables. It allows researchers to understand how changes in the independent variables affect the dependent variable.
Scatter Plot: A scatter plot is a type of data visualization that displays the relationship between two numerical variables by plotting individual data points on a two-dimensional graph. It allows for the identification of patterns, trends, and potential outliers in the data.
Series: A Series is a one-dimensional labeled data structure in the Pandas library, which is a fundamental data analysis tool in Python. It serves as the basic building block for more complex data structures and plays a crucial role in various aspects of data science, including exploratory data analysis and data visualization.
Time Series: A time series is a sequence of data points collected over time, typically at regular intervals. It is a fundamental concept in exploratory data analysis, as it allows researchers to analyze patterns, trends, and relationships within data that evolve over time.
Univariate Analysis: Univariate analysis is a statistical method used to analyze and describe a single variable or characteristic in a dataset. It focuses on understanding the distribution, central tendency, and variability of a single variable without considering any relationships or dependencies between variables.
© 2024 Fiveable Inc. All rights reserved.
AP® and SAT® are trademarks registered by the College Board, which is not affiliated with, and does not endorse this website.
Glossary
Glossary