Pandas is a Python library for organizing, cleaning, and analyzing data. Its main tools, DataFrames and Series, help you handle missing data, merge datasets, and work with time series.
Pandas integrates seamlessly with other Python libraries, enhancing your data analysis toolkit. Its user-friendly interface allows you to quickly gain insights from your data, whether you're working with CSV files, SQL databases, or custom data structures. Pandas simplifies the data preparation process, letting you focus on extracting meaningful information.
Introduction to Pandas
Purpose and features of Pandas
- Pandas powerful open-source library for data manipulation and analysis in Python
- Built on top of NumPy provides fast and efficient operations on arrays and matrices
- Key features of Pandas include
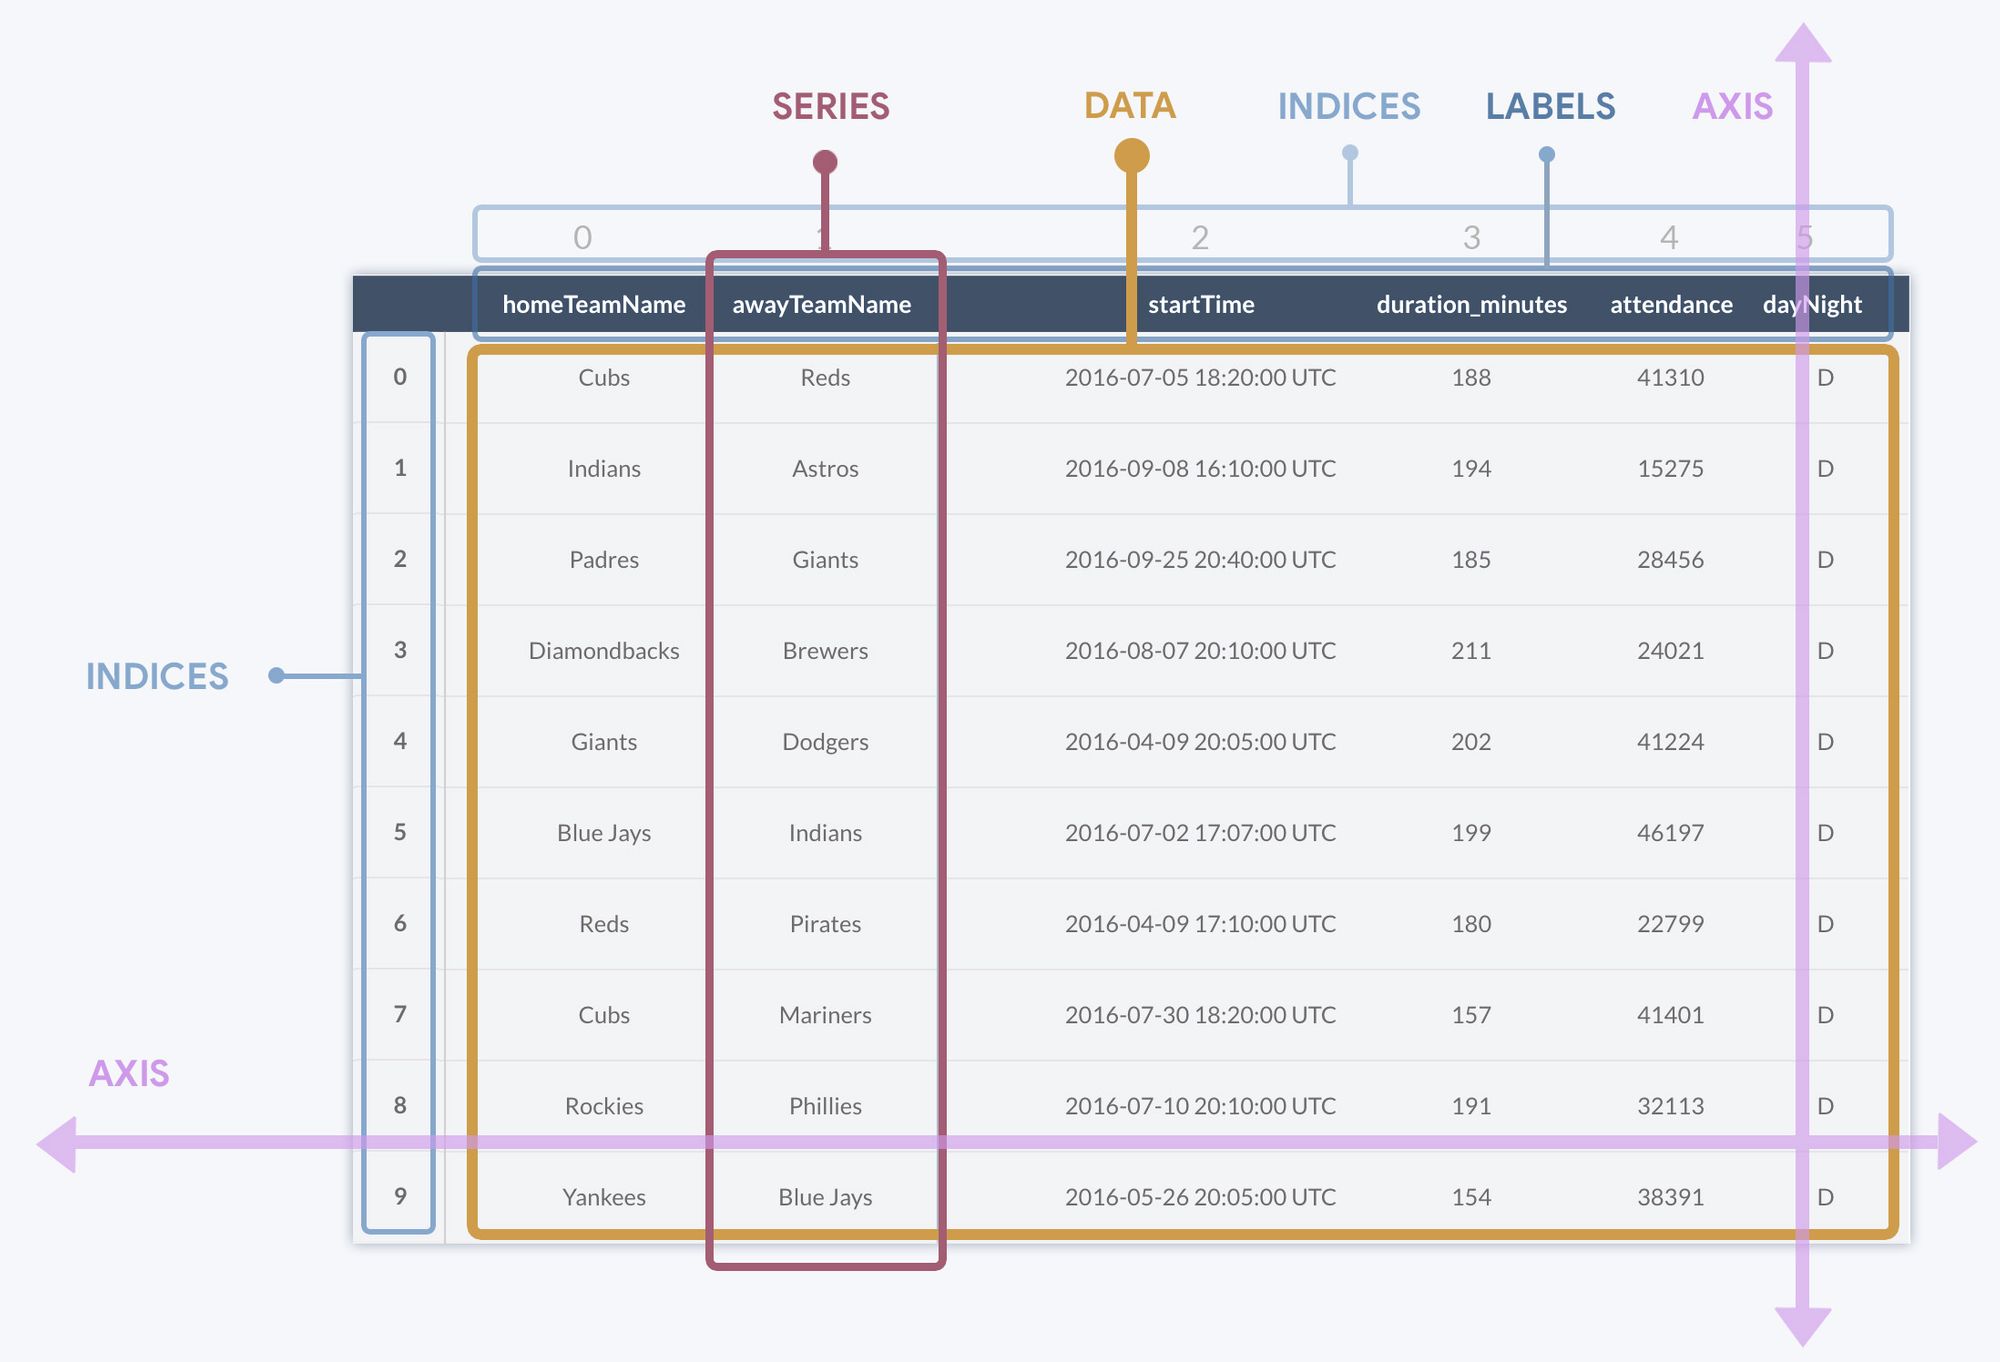
- DataFrame and Series objects for organizing and manipulating data
- DataFrames 2-dimensional labeled data structures with columns of potentially different types (integers, floats, strings)
- Series 1-dimensional labeled arrays capable of holding any data type (numbers, strings, Python objects)
- Data alignment and integrated indexing enables easy data access and transformation
- Handles missing data and supports data cleaning and preparation
- Merges, joins, and groups datasets for complex data operations
- Time series functionality for handling date and time data (timestamps, date ranges, frequency conversions)
- Integrates with other libraries such as matplotlib for data visualization (line plots, bar charts, histograms)
- DataFrame and Series objects for organizing and manipulating data
Creation of DataFrames and Series
- Creating DataFrames and Series
- DataFrames created from various sources
- Python dictionaries with column names as keys and lists or arrays as values
- Lists of dictionaries where each dictionary represents a row
- CSV files using
pd.read_csv() - SQL databases using
pd.read_sql()
- Series created from lists, arrays, or dictionaries using
pd.Series()
- DataFrames created from various sources
- Manipulating DataFrames and Series
- Access data using labels or integer-based indexing with
df.loc[]anddf.iloc[] - Filter data based on conditions using boolean indexing
- Add, modify, or delete columns using bracket notation or
df.assign() - Apply functions to columns or rows using
df.apply()ordf.applymap() - Sort data based on one or more columns using
df.sort_values() - Handle missing data using
df.fillna(),df.dropna(), ordf.interpolate()
- Access data using labels or integer-based indexing with
Data Analysis with Pandas
Data insights with Pandas functions
- Data cleaning and preparation
- Handle missing data by filling, interpolating, or dropping missing values
- Remove duplicates using
df.drop_duplicates() - Rename columns using
df.rename() - Convert data types using
df.astype()orpd.to_datetime()
- Data transformation
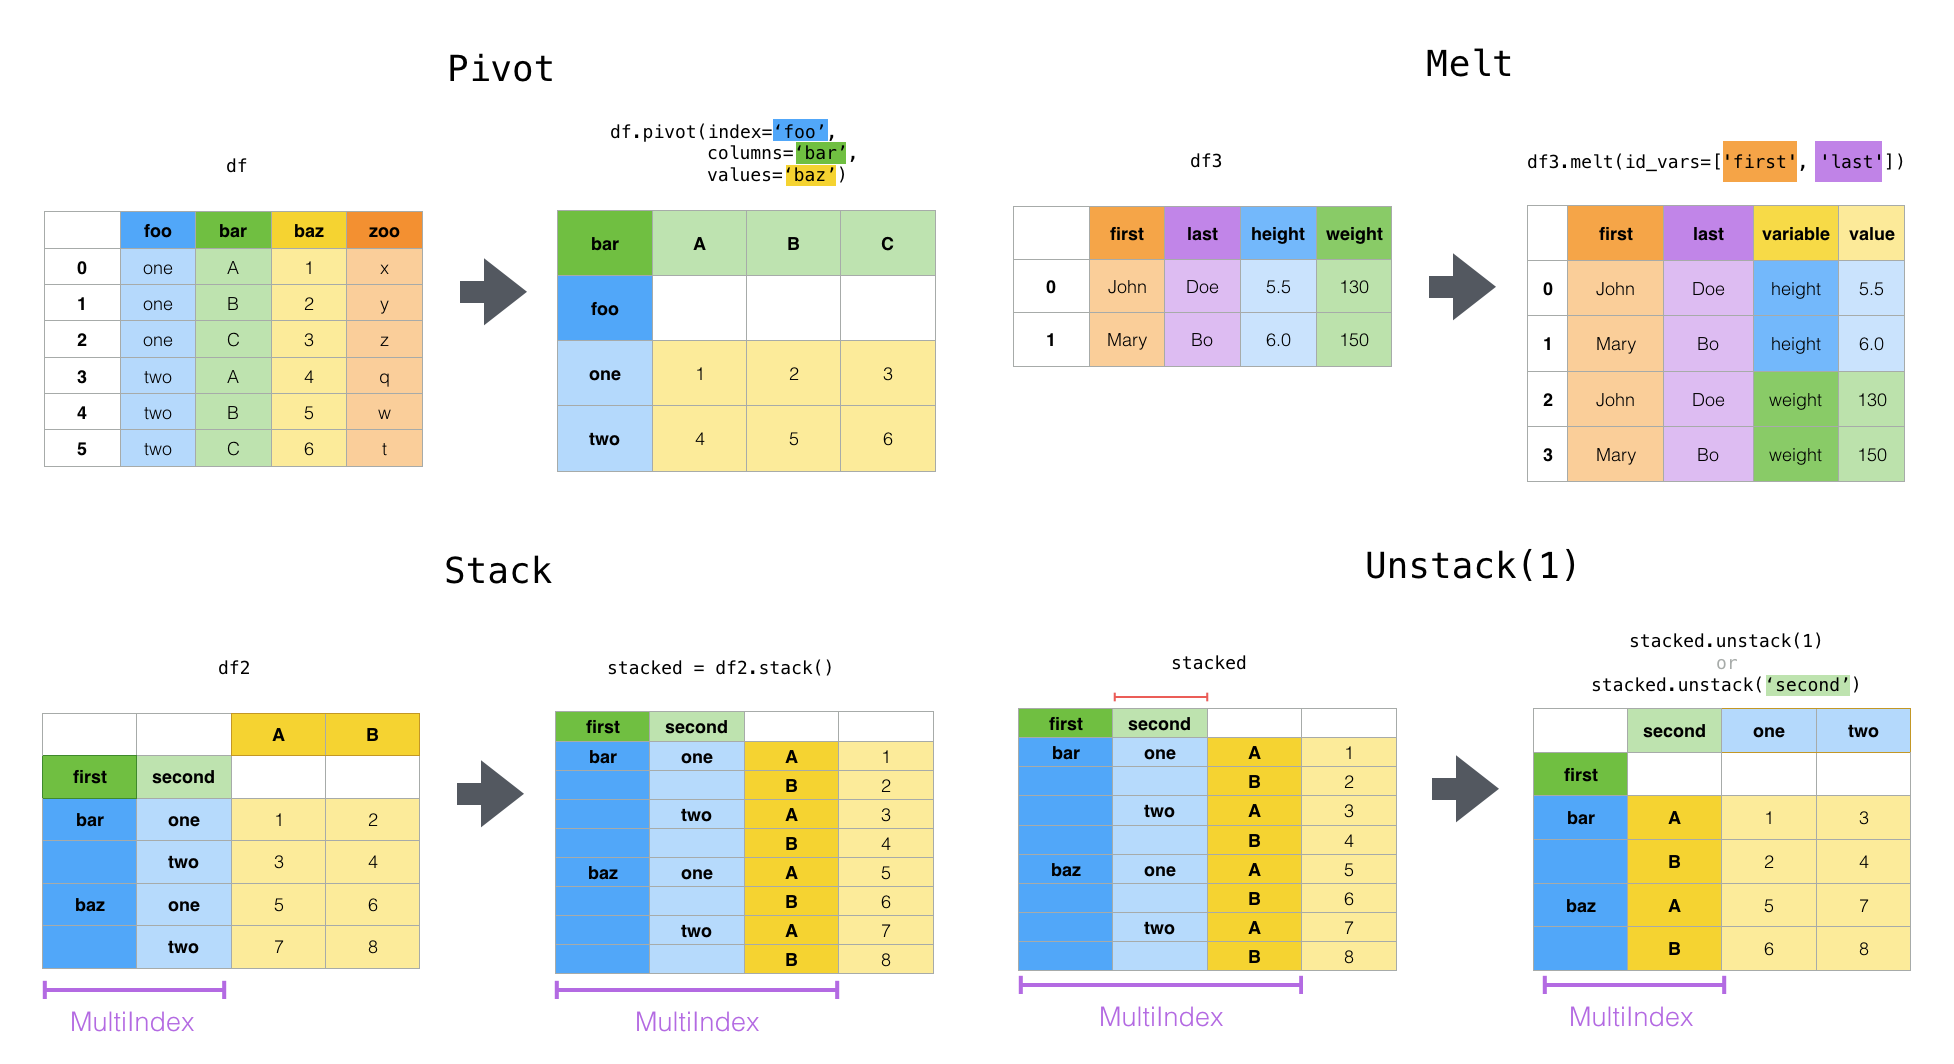
- Reshape data using
df.melt(),df.pivot(), ordf.stack()/df.unstack() - Aggregate data using
df.groupby()and apply functions likesum(),mean(), orcount() - Merge and join datasets using
pd.merge()orpd.concat()
- Reshape data using
- Basic analysis techniques
- Descriptive statistics using
df.describe()for summary statistics (mean, median, min, max) - Correlation analysis using
df.corr()to calculate pairwise correlations between columns - Time series analysis using
pd.date_range(),df.resample(), ordf.rolling()for date-based operations - Visualization using Pandas' integration with matplotlib for creating plots and charts (scatter plots, heatmaps)
- Descriptive statistics using
Pandas Core Components and Operations
- Data structures: DataFrame and Series as fundamental building blocks for organizing and manipulating data
- Indexing and selection: Various methods to access and filter data, including label-based and integer-based indexing
- Data cleaning: Tools for handling missing values, removing duplicates, and standardizing data formats
- Data transformation: Functions for reshaping, merging, and aggregating data to prepare it for analysis
- Data analysis: Techniques for extracting insights, calculating statistics, and identifying patterns in data
- Time series functionality: Specialized tools for working with date and time data, including resampling and rolling windows
- Input/output operations: Methods for reading from and writing to various file formats and databases, facilitating data import and export