5.1 Properties of Continuous Probability Density Functions

4 min readjune 25, 2024

Continuous probability distributions are essential in statistics, allowing us to model real-world phenomena with infinite possible outcomes. They use probability density functions (PDFs) to represent the likelihood of values, with the indicating probabilities for specific ranges.

Understanding continuous distributions involves mastering concepts like cumulative distribution functions (CDFs), which give probabilities for values below a certain point. These tools help analyze complex data and make predictions in fields ranging from finance to physics, forming the backbone of advanced statistical analysis.

Continuous Probability Distributions

Area under curve for probability

Top images from around the web for Area under curve for probability
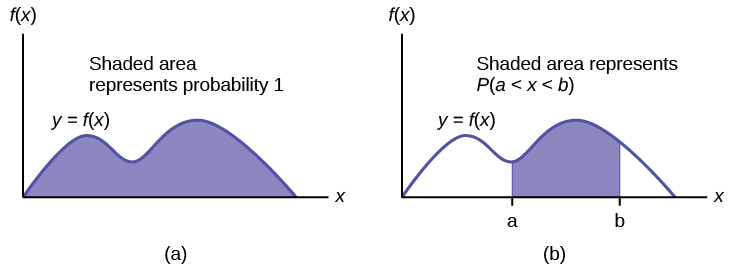
  • In continuous probability distributions, the probability of a falling within a specific range is represented by the area under the (PDF) curve within that range
    • The total area under the PDF curve always equals 1, representing the total probability of all possible outcomes (XX taking any value from -\infty to \infty)
    • The probability of a random variable taking on a specific value is 0, as there are infinitely many possible values in a continuous distribution (probability of X=3.14159...X = 3.14159... is 0)
  • To find the probability of a random variable falling within a range [a,b][a, b], calculate the definite integral of the PDF [f(x)](https://www.fiveableKeyTerm:f(x))[f(x)](https://www.fiveableKeyTerm:f(x)) from aa to bb:
    • P(aXb)=abf(x)dxP(a \leq X \leq b) = \int_a^b f(x) dx
    • Example: For a standard , P(1X1)=1112πex22dx0.6827P(-1 \leq X \leq 1) = \int_{-1}^1 \frac{1}{\sqrt{2\pi}}e^{-\frac{x^2}{2}} dx \approx 0.6827
  • The area under the curve can be calculated using techniques, such as the fundamental theorem of calculus or numerical methods (trapezoidal rule, Simpson's rule)

Intervals in cumulative distribution functions

  • The of a continuous random variable XX, denoted as F(x)F(x), gives the probability that XX is less than or equal to a specific value xx
    • F(x)=P(Xx)=xf(t)dtF(x) = P(X \leq x) = \int_{-\infty}^x f(t) dt, where f(t)f(t) is the
  • To calculate the probability of a random variable falling within an interval [a,b][a, b] using the CDF:
    • P(aXb)=F(b)F(a)P(a \leq X \leq b) = F(b) - F(a)
    • Example: For a standard , P(1X1)=F(1)F(1)0.84130.1587=0.6826P(-1 \leq X \leq 1) = F(1) - F(-1) \approx 0.8413 - 0.1587 = 0.6826
  • For the probability of a random variable being greater than a value aa:
    • P(X>a)=1F(a)P(X > a) = 1 - F(a)
    • Example: For an with rate parameter λ=0.5\lambda = 0.5, P(X>2)=1F(2)=1(1e0.52)0.3679P(X > 2) = 1 - F(2) = 1 - (1 - e^{-0.5 \cdot 2}) \approx 0.3679
  • CDF properties:
    1. Non-decreasing: F(a)F(b)F(a) \leq F(b) for a<ba < b
    2. Limits: limxF(x)=0\lim_{x \to -\infty} F(x) = 0 and limxF(x)=1\lim_{x \to \infty} F(x) = 1
    3. Right-continuous: limxa+F(x)=F(a)\lim_{x \to a^+} F(x) = F(a) for all aa
    4. : The CDF is a monotonically increasing function

Density vs cumulative distribution functions

  • Probability Density Function (PDF):
    • Denoted as f(x)f(x)
    • Represents the relative likelihood of a random variable taking on a specific value
    • The area under the PDF curve between two points represents the probability of the random variable falling within that range
    • Properties:
      • Non-negative: f(x)0f(x) \geq 0 for all xx
      • Total area under the curve is 1: f(x)dx=1\int_{-\infty}^{\infty} f(x) dx = 1
      • Does not directly give probabilities for specific values or ranges (area under a single point is 0)
      • The of the PDF is the set of all possible values the random variable can take
  • (CDF):
    • Denoted as F(x)F(x)
    • Represents the probability that a random variable is less than or equal to a specific value
    • Can be obtained by integrating the PDF: F(x)=xf(t)dtF(x) = \int_{-\infty}^x f(t) dt
    • Directly gives probabilities for specific values or ranges (P(Xx)=F(x)P(X \leq x) = F(x))
    • Properties:
      1. Non-decreasing: F(a)F(b)F(a) \leq F(b) for a<ba < b
      2. Limits: limxF(x)=0\lim_{x \to -\infty} F(x) = 0 and limxF(x)=1\lim_{x \to \infty} F(x) = 1
      3. Right-continuous: limxa+F(x)=F(a)\lim_{x \to a^+} F(x) = F(a) for all aa
  • The PDF and CDF are related by and integration:
    • F(x)=xf(t)dtF(x) = \int_{-\infty}^x f(t) dt
    • f(x)=ddxF(x)f(x) = \frac{d}{dx} F(x) (for continuous CDFs)
    • Example: For a standard normal distribution, the PDF is f(x)=12πex22f(x) = \frac{1}{\sqrt{2\pi}}e^{-\frac{x^2}{2}} and the CDF is F(x)=12[1+erf(x2)]F(x) = \frac{1}{2}\left[1 + \text{erf}\left(\frac{x}{\sqrt{2}}\right)\right]

Probability Space and Transformations

  • : A mathematical construct that models a real-world process consisting of events that occur randomly
    • It includes the sample space, event space, and probability measure
  • : A method used to derive the probability distribution of a function of a random variable
    • This technique is useful when dealing with functions of random variables or when changing coordinate systems

Key Terms to Review (29)

Area Under the Curve: The area under the curve, in the context of probability and statistics, refers to the region bounded by the x-axis and a continuous probability density function (PDF) curve. This area represents the probability or likelihood of a random variable falling within a specified range of values.
Continuous Random Variable: A continuous random variable is a type of random variable that can take on any value within a specified range or interval, rather than being limited to discrete or countable values. It is a fundamental concept in the study of probability and statistics, particularly in the context of continuous probability density functions.
Cumulative Distribution Function: The cumulative distribution function (CDF) is a fundamental concept in probability and statistics that describes the probability of a random variable taking a value less than or equal to a given value. It provides a comprehensive way to represent the distribution of a random variable and is closely related to other important statistical concepts such as probability density functions and probability mass functions.
Cumulative distribution function (CDF): A cumulative distribution function (CDF) represents the probability that a continuous random variable takes on a value less than or equal to a specific value. It is an integral of the probability density function (PDF).
Differentiation: Differentiation is a fundamental concept in calculus that describes the rate of change of a function at a specific point. It involves taking the derivative of a function, which represents the slope or tangent line to the function at that point, and provides insights into the behavior and properties of the function.
Equal standard deviations: Equal standard deviations, also known as homoscedasticity, occur when the variability within each group being compared is similar. This is an important assumption for performing One-Way ANOVA.
Error Function: The error function, denoted as erf(x), is a fundamental function in probability theory and statistics that describes the cumulative probability distribution of the standard normal distribution. It is a critical component in understanding the properties of continuous probability density functions.
Estimate of the error variance: Estimate of the error variance is a measure of the variability in the observed values that cannot be explained by the regression model. It is often denoted as $\hat{\sigma}^2$ and calculated as the sum of squared residuals divided by the degrees of freedom.
Expected mean: The expected mean in the context of linear regression is the average value of the response variable predicted by the regression equation for a given set of predictor variables. It represents the central tendency around which individual observations are expected to vary.
Expected value: Expected value is the weighted average of all possible values that a random variable can take on, with weights being their respective probabilities. It provides a measure of the center of the distribution of the variable.
Expected Value: Expected value is a statistical concept that represents the average or central tendency of a probability distribution. It is the weighted average of all possible outcomes, where the weights are the probabilities of each outcome occurring. The expected value provides a measure of the central tendency and is a useful tool for decision-making and analysis in various contexts, including the topics of 3.1 Terminology, 4.1 Hypergeometric Distribution, 4.2 Binomial Distribution, 5.1 Properties of Continuous Probability Density Functions, 5.2 The Uniform Distribution, and 6.3 Estimating the Binomial with the Normal Distribution.
Exponential distribution: The exponential distribution is a continuous probability distribution used to model the time between independent events that occur at a constant average rate. It is characterized by its parameter λ (lambda), which is the rate parameter.
Exponential Distribution: The exponential distribution is a continuous probability distribution that describes the time between events in a Poisson process. It is commonly used to model the waiting time between independent events that occur at a constant average rate.
F(x): In statistics, f(x) represents the probability density function (PDF) of a continuous random variable. It defines the likelihood of the variable taking on a particular value, where the area under the curve of f(x) across an interval equals the probability of the variable falling within that interval. This function plays a crucial role in understanding the distribution and behavior of continuous data, as well as establishing key properties such as normalization and integrability.
Gamma Function: The gamma function is a mathematical function that extends the factorial function to non-integer values. It is a continuous function that generalizes the factorial function to complex numbers, allowing for the evaluation of expressions involving factorials for any real or complex number argument, not just for positive integers.
Integration: Integration is a fundamental concept in calculus that describes the process of finding the area under a curve or the accumulation of a quantity over an interval. It is the inverse operation of differentiation, allowing us to determine the original function from its rate of change.
Law of Total Probability: The law of total probability is a fundamental concept in probability theory that describes how the probability of an event can be calculated when it is related to or dependent on other events. It provides a way to determine the overall probability of an event by considering the probabilities of its mutually exclusive and exhaustive subevents.
Mean: The mean, also known as the arithmetic mean, is a measure of central tendency that represents the average value in a dataset. It is calculated by summing up all the values in the dataset and dividing by the total number of values. The mean provides a summary statistic that describes the central or typical value in a distribution of data.
Monotonicity: Monotonicity is a mathematical property that describes the behavior of a function as it increases or decreases over a given domain. It is a crucial concept in the context of continuous probability density functions, as it helps determine the shape and characteristics of these functions.
Non-Negativity: Non-negativity is a fundamental property of continuous probability density functions, which ensures that the function takes on only non-negative values across its entire domain. This property is essential in defining valid probability distributions and enabling the calculation of probabilities associated with random variables.
Normal distribution: A normal distribution is a continuous probability distribution that is symmetrical and bell-shaped, where most of the observations cluster around the central peak. It is characterized by its mean ($\mu$) and standard deviation ($\sigma$).
Normal Distribution: The normal distribution, also known as the Gaussian distribution, is a continuous probability distribution that is symmetrical and bell-shaped. It is one of the most widely used probability distributions in statistics and plays a crucial role in various statistical analyses and concepts covered in this course.
Probability density function: A probability density function (PDF) describes the likelihood of a continuous random variable taking on a particular value. It is represented by a curve where the area under the curve within a given interval represents the probability that the variable falls within that interval.
Probability Density Function: A probability density function (PDF) is a mathematical function that describes the relative likelihood of a continuous random variable taking on a specific value. It provides a way to represent the distribution of a continuous random variable and is a fundamental concept in probability and statistics.
Probability Space: A probability space is a mathematical construct that defines the set of all possible outcomes of a random experiment, along with the associated probabilities of those outcomes. It is a fundamental concept in probability theory that provides the foundation for understanding and analyzing continuous probability density functions.
Standard Deviation: Standard deviation is a measure of the spread or dispersion of a set of data around the mean. It quantifies the typical deviation of values from the average, providing insight into the variability within a dataset.
Support: Support is the force or structure that holds up or maintains something, providing stability, strength, and assistance. In the context of continuous probability density functions, support refers to the range of values over which the function is defined and non-zero.
Transformation of Variables: Transformation of variables is a technique used in probability and statistics to modify the original variables in a probability distribution in order to simplify calculations or obtain a more tractable form of the distribution. This process involves applying a mathematical function to the original variables to create new transformed variables.
Variance: Variance is a measure of the spread or dispersion of a dataset, indicating how far each data point deviates from the mean or average value. It is a fundamental statistical concept that quantifies the variability within a distribution and plays a crucial role in various statistical analyses and probability distributions.
© 2024 Fiveable Inc. All rights reserved.
AP® and SAT® are trademarks registered by the College Board, which is not affiliated with, and does not endorse this website.
Glossary
Glossary