4.2 Binomial Distribution

3 min readjune 25, 2024

The is a powerful tool for analyzing scenarios with fixed trials and two possible outcomes. It helps calculate probabilities for events like coin flips, product defects, or survey responses, using key parameters like number of trials and .

Understanding the binomial distribution's characteristics, , and is crucial for real-world applications. From quality control to medical research, this concept allows us to make informed decisions based on probability calculations in various fields.

Binomial Distribution

Binomial distribution probability calculations

Top images from around the web for Binomial distribution probability calculations
  • Binomial distribution discrete describes number of successes in fixed number of , each with same probability of success
    • Formula for binomial : [P](https://www.fiveableKeyTerm:p)(X=k)=([n](https://www.fiveableKeyTerm:n)k)pk(1p)nk[P](https://www.fiveableKeyTerm:p)(X = k) = \binom{[n](https://www.fiveableKeyTerm:n)}{k} p^k (1-p)^{n-k}
      • nn: total number of trials (coin flips, product tests)
      • kk: number of successes (heads, defect-free products)
      • pp: probability of success on each trial (fairness of coin, manufacturing process reliability)
    • Calculate probability of specific number of successes by substituting values for nn, kk, and pp into formula
      • Probability of 3 heads in 5 coin flips with fair coin: P(X=3)=(53)(0.5)3(10.5)53P(X = 3) = \binom{5}{3} (0.5)^3 (1-0.5)^{5-3}
  • calculated by summing individual probabilities for all values of kk up to desired number of successes
    • P(Xk)=i=0k(ni)pi(1p)niP(X \leq k) = \sum_{i=0}^{k} \binom{n}{i} p^i (1-p)^{n-i}
      • Probability of 2 or fewer defective items in batch of 10 with 10% : P(X2)=i=02(10i)(0.1)i(10.1)10iP(X \leq 2) = \sum_{i=0}^{2} \binom{10}{i} (0.1)^i (1-0.1)^{10-i}
  • Many calculators and software packages have built-in functions for calculating binomial probabilities (
    BINOM.DIST
    in Excel)

Key characteristics of binomial experiments

  • Binomial experiment characteristics:
    • Fixed number of trials (nn) (number of coin flips, product tests)
    • Each trial independent of others (coin flips don't influence each other, products tested separately)
    • Each trial has only two possible outcomes (success or failure) (heads or tails, defective or non-defective)
    • Probability of success (pp) constant for each trial (fairness of coin, manufacturing process consistency)
    • Trials exhibit
  • Real-world applications of binomial distribution include:
    • Quality control: Probability of certain number of defective items in batch (electronics manufacturing, food production)
    • Marketing: Likelihood of specific number of customers responding to promotional offer (email campaign, product launch)
    • Medical research: Probability of certain number of patients experiencing side effects from treatment (drug trials, surgical procedures)
    • Finance: Probability of specific number of defaults in loan portfolio (mortgage lending, credit card issuing)

Mean and standard deviation in binomial distributions

  • Mean () of binomial distribution given by: μ=E(X)=np\mu = E(X) = np
    • nn: total number of trials (survey respondents, product tests)
    • pp: probability of success on each trial (response rate, defect rate)
      • Expected number of defective items in batch of 100 with 5% defect rate: μ=100×0.05=5\mu = 100 \times 0.05 = 5
  • Standard deviation of binomial distribution given by: σ=np(1p)\sigma = \sqrt{np(1-p)}
    • nn: total number of trials (coin flips, patients in study)
    • pp: probability of success on each trial (heads, treatment effectiveness)
      • Standard deviation of number of heads in 50 coin flips with fair coin: σ=50×0.5×(10.5)3.54\sigma = \sqrt{50 \times 0.5 \times (1-0.5)} \approx 3.54
  • Mean and standard deviation formulas used to:
    1. Describe central tendency and dispersion of distribution
    2. Calculate and for binomial distribution
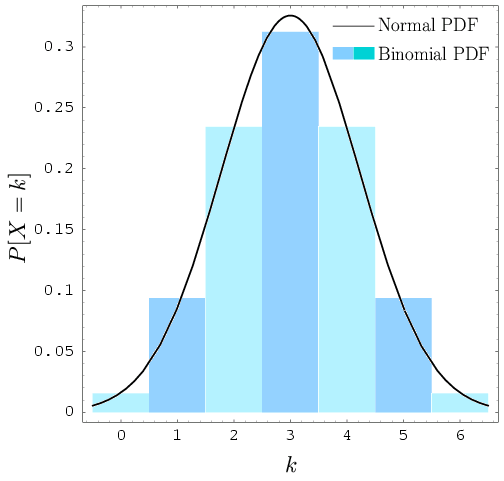
    3. Approximate binomial distribution with normal distribution when nn is large and pp not close to 0 or 1 (typically, when np10np \geq 10 and n(1p)10n(1-p) \geq 10)

Additional Concepts in Probability Theory

  • : A variable whose possible values are outcomes of a random phenomenon (e.g., number of successes in a binomial experiment)
  • Probability distribution: A description of the probabilities associated with all possible values of a (binomial distribution is an example)
  • : Events that cannot occur simultaneously (e.g., success and failure in a single trial of a binomial experiment)
  • : The mathematical study of counting, arrangement, and combination of objects, which is crucial in calculating binomial probabilities
  • : As the number of trials in a binomial experiment increases, the observed proportion of successes tends to approach the true probability of success

Key Terms to Review (33)

Bar graph: A bar graph is a visual representation of data using rectangular bars to compare different categories or groups. The lengths of the bars are proportional to the values they represent.
Bernoulli Trial: A Bernoulli trial is a basic probabilistic experiment that has only two possible outcomes: success or failure. It is a fundamental concept in probability theory and is often used as a building block for more complex probability models, such as the binomial distribution.
Binomial Distribution: The binomial distribution is a discrete probability distribution that models the number of successes in a fixed number of independent Bernoulli trials, where each trial has only two possible outcomes: success or failure. It is a fundamental concept in probability theory and statistics, with applications in various fields, including quality control, risk analysis, and decision-making.
Binomial probability distribution: A binomial probability distribution represents the number of successes in a fixed number of trials, each with the same probability of success. It is used to model scenarios where there are only two possible outcomes.
Binomial Test: The binomial test is a statistical hypothesis test used to determine whether the proportion of successes in a binomial experiment is significantly different from a hypothesized proportion. It is particularly useful when analyzing data from experiments with a binary outcome, such as success/failure or yes/no responses.
Combinatorics: Combinatorics is the branch of mathematics that deals with the study of discrete structures and the counting of these structures. It focuses on enumerating, combining, and optimizing finite sets, often with the goal of finding the most efficient or elegant solutions to problems involving combinations, permutations, and other mathematical arrangements.
Cumulative Binomial Probability: Cumulative binomial probability refers to the probability of obtaining a certain number of successes or fewer in a series of independent Bernoulli trials, where each trial has only two possible outcomes: success or failure. It represents the cumulative or total probability of achieving the desired outcome up to a specific point in the series of trials.
Defect Rate: The defect rate is a measure of the quality and reliability of a product or process. It represents the proportion or percentage of units or items that are defective or do not meet the specified standards or requirements.
Discrete Probability: Discrete probability refers to the likelihood or chance of an event occurring when the possible outcomes are distinct, separate, and countable. It is concerned with the probabilities of discrete random variables, which can only take on specific, individual values rather than a continuous range of values.
Equal standard deviations: Equal standard deviations, also known as homoscedasticity, occur when the variability within each group being compared is similar. This is an important assumption for performing One-Way ANOVA.
Estimate of the error variance: Estimate of the error variance is a measure of the variability in the observed values that cannot be explained by the regression model. It is often denoted as $\hat{\sigma}^2$ and calculated as the sum of squared residuals divided by the degrees of freedom.
Expected mean: The expected mean in the context of linear regression is the average value of the response variable predicted by the regression equation for a given set of predictor variables. It represents the central tendency around which individual observations are expected to vary.
Expected value: Expected value is the weighted average of all possible values that a random variable can take on, with weights being their respective probabilities. It provides a measure of the center of the distribution of the variable.
Expected Value: Expected value is a statistical concept that represents the average or central tendency of a probability distribution. It is the weighted average of all possible outcomes, where the weights are the probabilities of each outcome occurring. The expected value provides a measure of the central tendency and is a useful tool for decision-making and analysis in various contexts, including the topics of 3.1 Terminology, 4.1 Hypergeometric Distribution, 4.2 Binomial Distribution, 5.1 Properties of Continuous Probability Density Functions, 5.2 The Uniform Distribution, and 6.3 Estimating the Binomial with the Normal Distribution.
Independent Trials: Independent trials refer to a series of experiments or observations where the outcome of one trial does not affect the outcome of any other trial. Each trial is independent and the results are not influenced by previous or subsequent trials.
Jacob Bernoulli: Jacob Bernoulli was a Swiss mathematician who made significant contributions to the field of probability theory. He is particularly known for his work on the binomial distribution, which has become a fundamental concept in statistics and probability.
Law of large numbers: The Law of Large Numbers states that as the number of trials or observations increases, the average of the results becomes closer to the expected value. This principle is fundamental in probability and statistics.
Law of Large Numbers: The law of large numbers is a fundamental principle in probability and statistics that states that as the number of observations or trials in an experiment increases, the sample mean or proportion will converge to the true population mean or proportion. This principle helps explain why statistical estimates become more reliable as the sample size grows larger.
Mean: The mean, also known as the arithmetic mean, is a measure of central tendency that represents the average value in a dataset. It is calculated by summing up all the values in the dataset and dividing by the total number of values. The mean provides a summary statistic that describes the central or typical value in a distribution of data.
Mutually Exclusive Events: Mutually exclusive events are a set of events where the occurrence of one event prevents the occurrence of the other events. In other words, if one event happens, the other events cannot happen simultaneously.
N: In statistics, 'n' represents the sample size, which is the number of observations or data points collected from a population for analysis. This key concept is crucial as it impacts the reliability and validity of statistical estimates, influencing the power of hypothesis tests and the precision of confidence intervals.
Normal Approximation: The normal approximation is a statistical technique that allows for the use of the normal distribution to estimate the probability of events in a binomial distribution when certain conditions are met. This concept is particularly relevant in the context of various statistical analyses and hypothesis testing.
P: The probability of a single event occurring in a Bernoulli trial, where the event can have one of two possible outcomes (success or failure). The value of 'p' represents the likelihood of the desired outcome (success) happening in a single trial. It is a fundamental parameter in the Binomial and Geometric probability distributions, as well as in the estimation of sample size for continuous and binary random variables.
Percentiles: Percentiles are statistical measures that divide a dataset into one hundred equal parts, allowing for the identification of the relative position of a data point within the overall distribution. This concept is integral to understanding the location and spread of data, as well as the skewness of a distribution and the interpretation of probability distributions like the binomial distribution.
Probability Distribution: A probability distribution is a mathematical function that describes the possible values and their associated probabilities for a random variable. It is a fundamental concept in probability theory and statistics, as it provides a framework for understanding and analyzing the likelihood of different outcomes occurring in a given scenario.
Probability Mass Function: The probability mass function (PMF) is a fundamental concept in probability theory that describes the probability distribution of a discrete random variable. It assigns a probability to each possible value that the random variable can take, providing a complete description of the likelihood of different outcomes occurring.
Random variable: A random variable is a numerical outcome of a random phenomenon. It can take on different values, each with an associated probability.
Random Variable: A random variable is a numerical quantity whose value is determined by the outcome of a random phenomenon. It is a variable that can take on different values with certain probabilities, allowing for the quantification of uncertainty and the analysis of random processes.
Standard Deviation: Standard deviation is a measure of the spread or dispersion of a set of data around the mean. It quantifies the typical deviation of values from the average, providing insight into the variability within a dataset.
Statistical Independence: Statistical independence is a fundamental concept in probability theory and statistics, which describes a situation where the occurrence or non-occurrence of one event does not affect the probability of another event. It is a crucial assumption in various statistical analyses, particularly in the context of the binomial distribution.
Success Probability: Success probability refers to the likelihood or chance of an event occurring in a given situation or experiment. It is a fundamental concept in the study of probability and statistics, particularly in the context of the binomial distribution.
Variance: Variance is a measure of the spread or dispersion of a dataset, indicating how far each data point deviates from the mean or average value. It is a fundamental statistical concept that quantifies the variability within a distribution and plays a crucial role in various statistical analyses and probability distributions.
Z-scores: A z-score, also known as a standard score, is a statistical measurement that describes a value's relationship to the mean of a group. It is calculated by subtracting the mean from the individual value and then dividing the result by the standard deviation. Z-scores are commonly used to analyze and compare data in various fields, including the context of the Binomial Distribution.
© 2024 Fiveable Inc. All rights reserved.
AP® and SAT® are trademarks registered by the College Board, which is not affiliated with, and does not endorse this website.
Glossary
Glossary