Clustering-based segmentation is a powerful technique for analyzing images as data. By grouping similar pixels or regions, these algorithms help identify distinct objects and areas within images, enabling more effective analysis of visual information.
Different clustering approaches, like K-means, hierarchical, and density-based methods, offer unique strengths for various image segmentation tasks. Understanding these algorithms, along with proper preprocessing and parameter tuning, is crucial for extracting meaningful insights from complex visual data.
Types of clustering algorithms
- Clustering algorithms play a crucial role in image segmentation by grouping similar pixels or regions together
- In the context of Images as Data, these algorithms help identify distinct objects or areas within an image based on shared characteristics
- Understanding different clustering approaches enables more effective analysis and interpretation of visual data
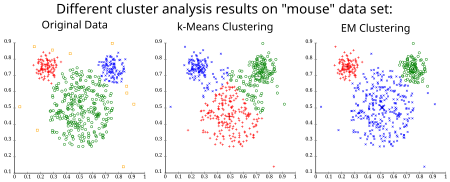
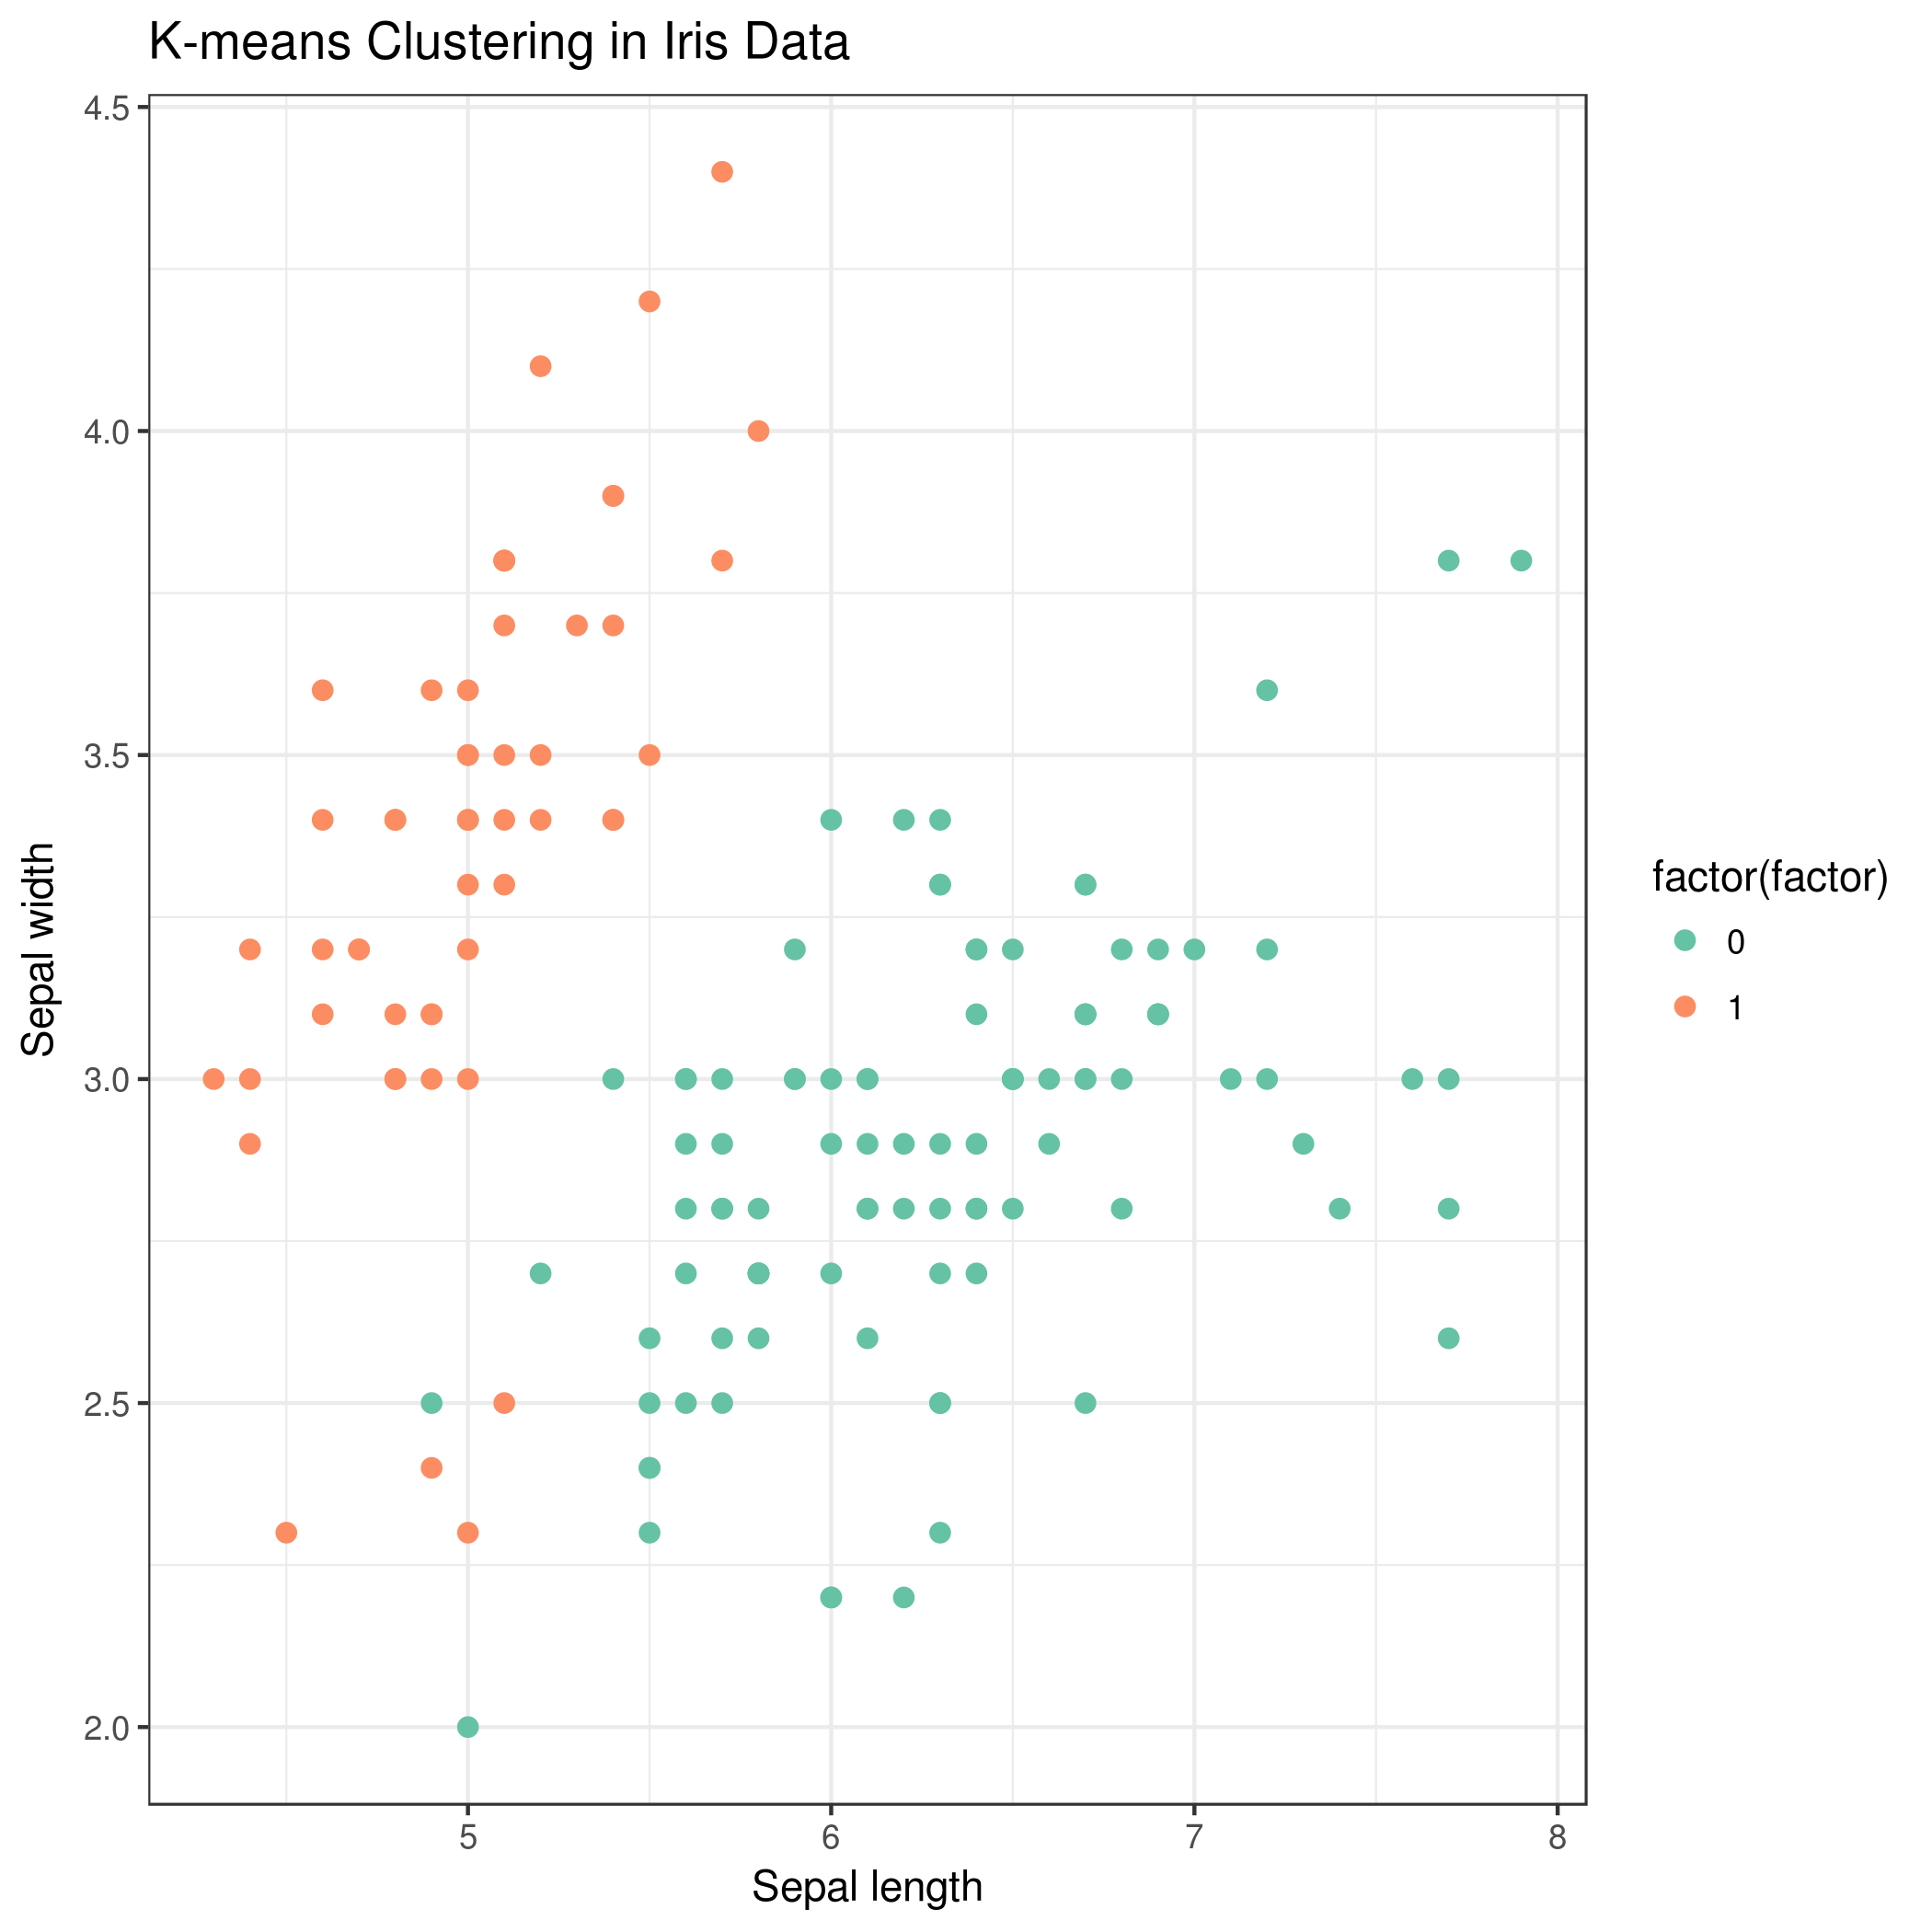
K-means clustering
- Partitions data into K predefined clusters based on minimizing within-cluster variances
- Iteratively assigns data points to the nearest cluster centroid and updates centroids
- Widely used for its simplicity and efficiency in image segmentation tasks
- Requires specifying the number of clusters (K) beforehand
- Sensitive to initial centroid placement and may converge to local optima
Hierarchical clustering
- Builds a tree-like structure of clusters, known as a dendrogram
- Two main approaches: agglomerative (bottom-up) and divisive (top-down)
- Agglomerative clustering starts with individual data points and merges similar clusters
- Divisive clustering begins with all data in one cluster and recursively splits it
- Provides a multi-scale view of image segmentation, allowing analysis at different levels of granularity
- Does not require specifying the number of clusters in advance
Density-based clustering
- Groups data points based on areas of high density separated by areas of low density
- DBSCAN (Density-Based Spatial Clustering of Applications with Noise) algorithm commonly used
- Effective for detecting clusters of arbitrary shapes in image data
- Handles noise and outliers well, making it robust for real-world image segmentation tasks
- Requires specifying density parameters (epsilon and minimum points) instead of the number of clusters
- Struggles with clusters of varying densities within the same image
Image preprocessing for segmentation
- Image preprocessing enhances the quality and suitability of input data for clustering-based segmentation
- These techniques aim to reduce noise, normalize data, and extract relevant features from images
- Proper preprocessing significantly improves the accuracy and reliability of subsequent clustering algorithms
Color space conversion
- Transforms image data from one color representation to another (RGB, HSV, LAB)
- RGB (Red, Green, Blue) represents colors as combinations of primary colors
- HSV (Hue, Saturation, Value) separates color information from intensity
- LAB color space designed to approximate human vision, with L for lightness and A and B for color dimensions
- Choice of color space affects clustering performance and interpretability of results
- LAB color space often preferred for its perceptual uniformity in image segmentation tasks
Noise reduction techniques
- Removes unwanted variations in pixel intensities to improve segmentation accuracy
- Gaussian filtering applies a weighted average to smooth out noise
- Median filtering replaces each pixel with the median value of its neighbors
- Non-local means denoising preserves edges while reducing noise by averaging similar patches
- Bilateral filtering combines spatial and intensity information to reduce noise while preserving edges
- Choice of noise reduction method depends on the type of noise present in the image
Feature extraction methods
- Identifies and extracts relevant characteristics from images to improve clustering performance
- Texture features capture patterns and spatial arrangements of pixel intensities
- Gray Level Co-occurrence Matrix (GLCM) quantifies texture properties
- Local Binary Patterns (LBP) describe local texture patterns
- Edge detection highlights boundaries between different regions in an image
- Sobel operator detects edges by computing image gradients
- Canny edge detection provides a multi-stage approach for accurate edge detection
- Dimensionality reduction techniques compress high-dimensional image data
- Principal Component Analysis (PCA) reduces dimensionality while preserving variance
- t-SNE (t-Distributed Stochastic Neighbor Embedding) for non-linear dimensionality reduction
Clustering parameters
- Clustering parameters significantly influence the performance and results of segmentation algorithms
- Proper selection of these parameters is crucial for achieving accurate and meaningful image segmentation
- Parameter tuning often requires experimentation and domain knowledge specific to the image analysis task
Number of clusters
- Determines the granularity of segmentation in algorithms like K-means
- Elbow method plots the within-cluster sum of squares against the number of clusters
- Silhouette analysis measures how similar an object is to its own cluster compared to other clusters
- Gap statistic compares the total within intra-cluster variation with expected values under null distribution
- Domain knowledge and visual inspection often guide the final selection of cluster numbers
- Hierarchical clustering can provide insights into appropriate cluster numbers through dendrogram analysis
Distance metrics
- Measures the similarity or dissimilarity between data points in the feature space
- Euclidean distance calculates the straight-line distance between two points
- Manhattan distance sums the absolute differences of coordinates
- Cosine similarity measures the cosine of the angle between two vectors
- Mahalanobis distance accounts for the covariance structure of the data
- Choice of distance metric affects the shape and size of clusters formed
- Some metrics perform better with specific types of image data or feature representations
Initialization methods
- Determines the starting points for iterative clustering algorithms like K-means
- Random initialization selects K random data points as initial centroids
- K-means++ algorithm chooses initial centroids to be far apart, improving convergence
- Hierarchical clustering results can initialize K-means for potentially better performance
- Multiple random initializations with selection of best result can mitigate sensitivity to initialization
- Careful initialization can lead to faster convergence and more stable clustering results
Evaluation of segmentation results
- Assessing the quality of image segmentation is crucial for validating and improving clustering algorithms
- Evaluation methods combine quantitative metrics with qualitative visual inspection
- Comparing segmentation results against ground truth annotations, when available, provides valuable insights
Silhouette coefficient
- Measures how similar an object is to its own cluster compared to other clusters
- Ranges from -1 to 1, with higher values indicating better-defined clusters
- Calculated for each data point and averaged across the entire dataset
- Helps in determining the optimal number of clusters for algorithms like K-means
- Can be visualized as a silhouette plot to identify poorly-clustered regions in the image
- Useful for comparing different clustering algorithms or parameter settings
Davies-Bouldin index
- Evaluates the ratio of within-cluster distances to between-cluster distances
- Lower values indicate better clustering with compact, well-separated clusters
- Does not depend on the number of clusters, allowing comparison across different segmentations
- Calculated by averaging the similarity measure of each cluster with its most similar cluster
- Particularly useful for assessing the quality of K-means clustering results
- Can be used to automatically select the optimal number of clusters
Visual inspection techniques
- Involves human evaluation of segmentation results to assess quality and meaningfulness
- Overlay segmentation boundaries on the original image to check accuracy
- Use false color representations to highlight different segments clearly
- Compare segmentation results side-by-side with the original image
- Interactive tools allow zooming and panning to examine fine details of segmentation
- Combine visual inspection with quantitative metrics for comprehensive evaluation
- Essential for detecting artifacts or errors not captured by numerical metrics alone
Applications in image analysis
- Clustering-based segmentation finds diverse applications across various domains of image analysis
- These techniques enable automated extraction of meaningful information from complex visual data
- Adaptability of clustering algorithms allows their use in a wide range of image types and analysis tasks
Object detection
- Identifies and locates specific objects within an image
- Clustering algorithms group similar pixels or regions to form potential object candidates
- K-means clustering can separate foreground objects from the background
- Hierarchical clustering helps in detecting objects at different scales
- Density-based clustering effective for detecting objects with irregular shapes
- Often combined with machine learning techniques for improved accuracy and classification
Medical image segmentation
- Segments anatomical structures or abnormalities in medical imaging data
- Clustering algorithms partition MRI, CT, or ultrasound images into distinct regions
- K-means clustering used for brain tissue segmentation in MRI scans
- Fuzzy c-means clustering effective for handling partial volume effects in medical images
- Hierarchical clustering aids in multi-scale analysis of tissue structures
- Crucial for diagnosis, treatment planning, and quantitative analysis in healthcare
Satellite imagery analysis
- Applies clustering techniques to segment and classify features in aerial or satellite images
- K-means clustering used for land cover classification (urban, forest, water bodies)
- Density-based clustering effective for detecting irregular shapes like river networks
- Hierarchical clustering helps in analyzing vegetation patterns at different scales
- Spectral clustering leverages multispectral information in satellite imagery
- Applications include urban planning, environmental monitoring, and agricultural management
Challenges and limitations
- Understanding the challenges in clustering-based segmentation is crucial for effective implementation
- These limitations often guide the choice of algorithm and preprocessing techniques
- Addressing these challenges is an active area of research in image analysis and computer vision
Sensitivity to initialization
- K-means and some other clustering algorithms are sensitive to initial centroid placement
- Poor initialization can lead to suboptimal or inconsistent segmentation results
- Multiple runs with different initializations may be necessary to find the best solution
- K-means++ initialization method aims to choose better starting centroids
- Ensemble methods combining multiple clustering results can improve robustness
- Hierarchical clustering algorithms are less affected by initialization issues
Handling irregular shapes
- Many clustering algorithms assume globular or convex cluster shapes
- Real-world objects in images often have irregular or non-convex shapes
- K-means struggles with elongated or intertwined structures in images
- Density-based methods like DBSCAN better handle arbitrary shapes but are sensitive to density parameters
- Spectral clustering can capture non-convex shapes by using similarity graphs
- Post-processing techniques or region-growing approaches can refine segmentation of irregular shapes
Computational complexity
- Large images or high-dimensional feature spaces can lead to significant computational overhead
- K-means has a time complexity of O(nkdi), where n is the number of points, k is the number of clusters, d is the number of dimensions, and i is the number of iterations
- Hierarchical clustering can be computationally expensive with O(n^3) complexity for large datasets
- Density-based clustering algorithms may require expensive nearest neighbor computations
- Dimensionality reduction techniques can help mitigate computational issues
- Parallel processing and GPU acceleration can significantly speed up clustering algorithms for large images
Advanced clustering techniques
- Advanced clustering methods address limitations of traditional algorithms and offer improved performance
- These techniques often incorporate additional information or use more sophisticated mathematical frameworks
- Understanding advanced clustering approaches enables tackling complex image segmentation challenges
Fuzzy c-means clustering
- Extends K-means by allowing data points to belong to multiple clusters with varying degrees of membership
- Useful for handling ambiguous boundaries or gradual transitions in images
- Each data point assigned a membership value between 0 and 1 for each cluster
- Iteratively updates cluster centers and membership values to minimize objective function
- Particularly effective for medical image segmentation where tissue boundaries are often fuzzy
- Requires specifying a fuzziness parameter that controls the degree of cluster overlap
Spectral clustering
- Performs clustering in a lower-dimensional space derived from the spectrum of the similarity matrix
- Effective for capturing non-linear and non-convex cluster shapes in image data
- Constructs a similarity graph representing relationships between data points
- Computes the Laplacian matrix of the similarity graph
- Uses eigenvectors of the Laplacian for dimensionality reduction before applying K-means
- Particularly useful for texture-based segmentation and handling complex image structures
Mean shift clustering
- Non-parametric clustering technique that does not require specifying the number of clusters
- Seeks modes or local maxima of the underlying probability density function
- Iteratively shifts data points towards areas of higher density
- Automatically determines the number of clusters based on the modes found
- Effective for image segmentation tasks with unknown number of segments
- Requires careful selection of bandwidth parameter which affects the scale of clustering
Integration with other methods
- Combining clustering with other segmentation approaches often leads to improved results
- Integration allows leveraging strengths of different methods while mitigating their individual weaknesses
- Hybrid approaches are particularly useful for complex image segmentation tasks
Clustering vs thresholding
- Thresholding separates image regions based on pixel intensity values
- Simple thresholding uses a single global threshold value
- Adaptive thresholding applies different thresholds to different image regions
- Clustering provides more flexibility in handling multi-dimensional feature spaces
- Otsu's method for optimal thresholding can be viewed as a special case of K-means with K=2
- Combining thresholding with clustering can improve segmentation of images with varying illumination
Hybrid segmentation approaches
- Combines multiple segmentation techniques to achieve better results
- Graph-cut methods integrate clustering results with edge information for refined segmentation
- Watershed transformation combined with clustering for improved boundary detection
- Region growing algorithms initialized with clustering results for more accurate region delineation
- Markov Random Field models incorporate spatial context into clustering-based segmentation
- Ensemble methods combine results from multiple clustering algorithms for robust segmentation
Machine learning enhancements
- Integrates clustering with supervised and unsupervised machine learning techniques
- Deep learning models like convolutional neural networks (CNNs) can extract features for clustering
- Autoencoders learn compact representations of image data for improved clustering
- Semi-supervised learning approaches use limited labeled data to guide clustering process
- Reinforcement learning techniques optimize clustering parameters based on segmentation quality
- Transfer learning allows adapting pre-trained models for specific image segmentation tasks
Software tools and libraries
- Various software tools and libraries facilitate implementation of clustering-based image segmentation
- These resources provide efficient implementations of algorithms and supporting functions
- Familiarity with these tools enables faster development and experimentation in image analysis projects
OpenCV for clustering
- Open-source computer vision library with extensive image processing capabilities
- Provides implementations of K-means and other clustering algorithms
- Offers various pre-processing functions for noise reduction and feature extraction
- Supports multiple programming languages including Python, C++, and Java
- Includes functions for color space conversions and image filtering
- Efficient implementation allows for real-time image processing and segmentation
scikit-learn implementations
- Machine learning library for Python with implementations of various clustering algorithms
- Offers K-means, hierarchical clustering, DBSCAN, and spectral clustering
- Provides tools for parameter tuning and model evaluation
- Integrates well with other scientific Python libraries like NumPy and SciPy
- Includes dimensionality reduction techniques useful for image feature preprocessing
- Offers consistent API across different clustering algorithms for easy experimentation
MATLAB image processing toolbox
- Comprehensive toolbox for image analysis and algorithm development
- Provides built-in functions for various clustering algorithms including K-means and fuzzy c-means
- Offers advanced image preprocessing and feature extraction capabilities
- Includes visualization tools for displaying and analyzing segmentation results
- Supports rapid prototyping and algorithm development with high-level programming interface
- Provides extensive documentation and examples for image segmentation tasks