Power analysis is crucial for determining sample sizes in experimental designs. It helps researchers detect meaningful effects with confidence, ensuring studies have sufficient statistical power to draw valid conclusions.
Different types of power analysis are used for various statistical tests. These include t-tests, ANOVA, regression, and chi-square analyses. Tools like G*Power make it easier to perform power calculations for diverse experimental setups.
Types of Power Analysis
Comparing Means and Variances
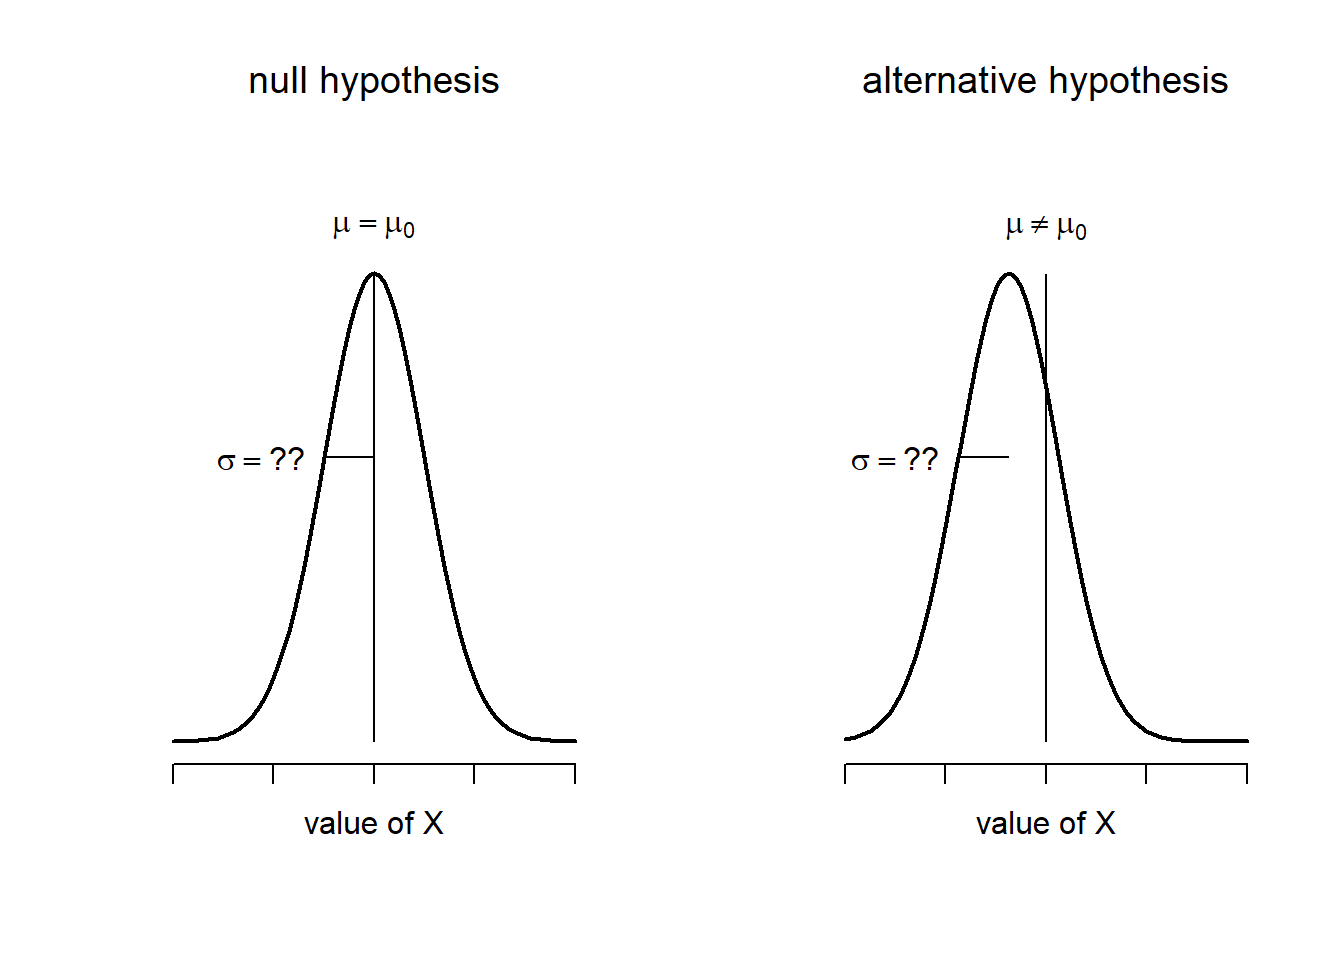
- T-test power analysis determines the sample size needed to detect a specified difference between two means with a given level of confidence and power
- Assumes the data follows a normal distribution and the variances of the two groups are equal
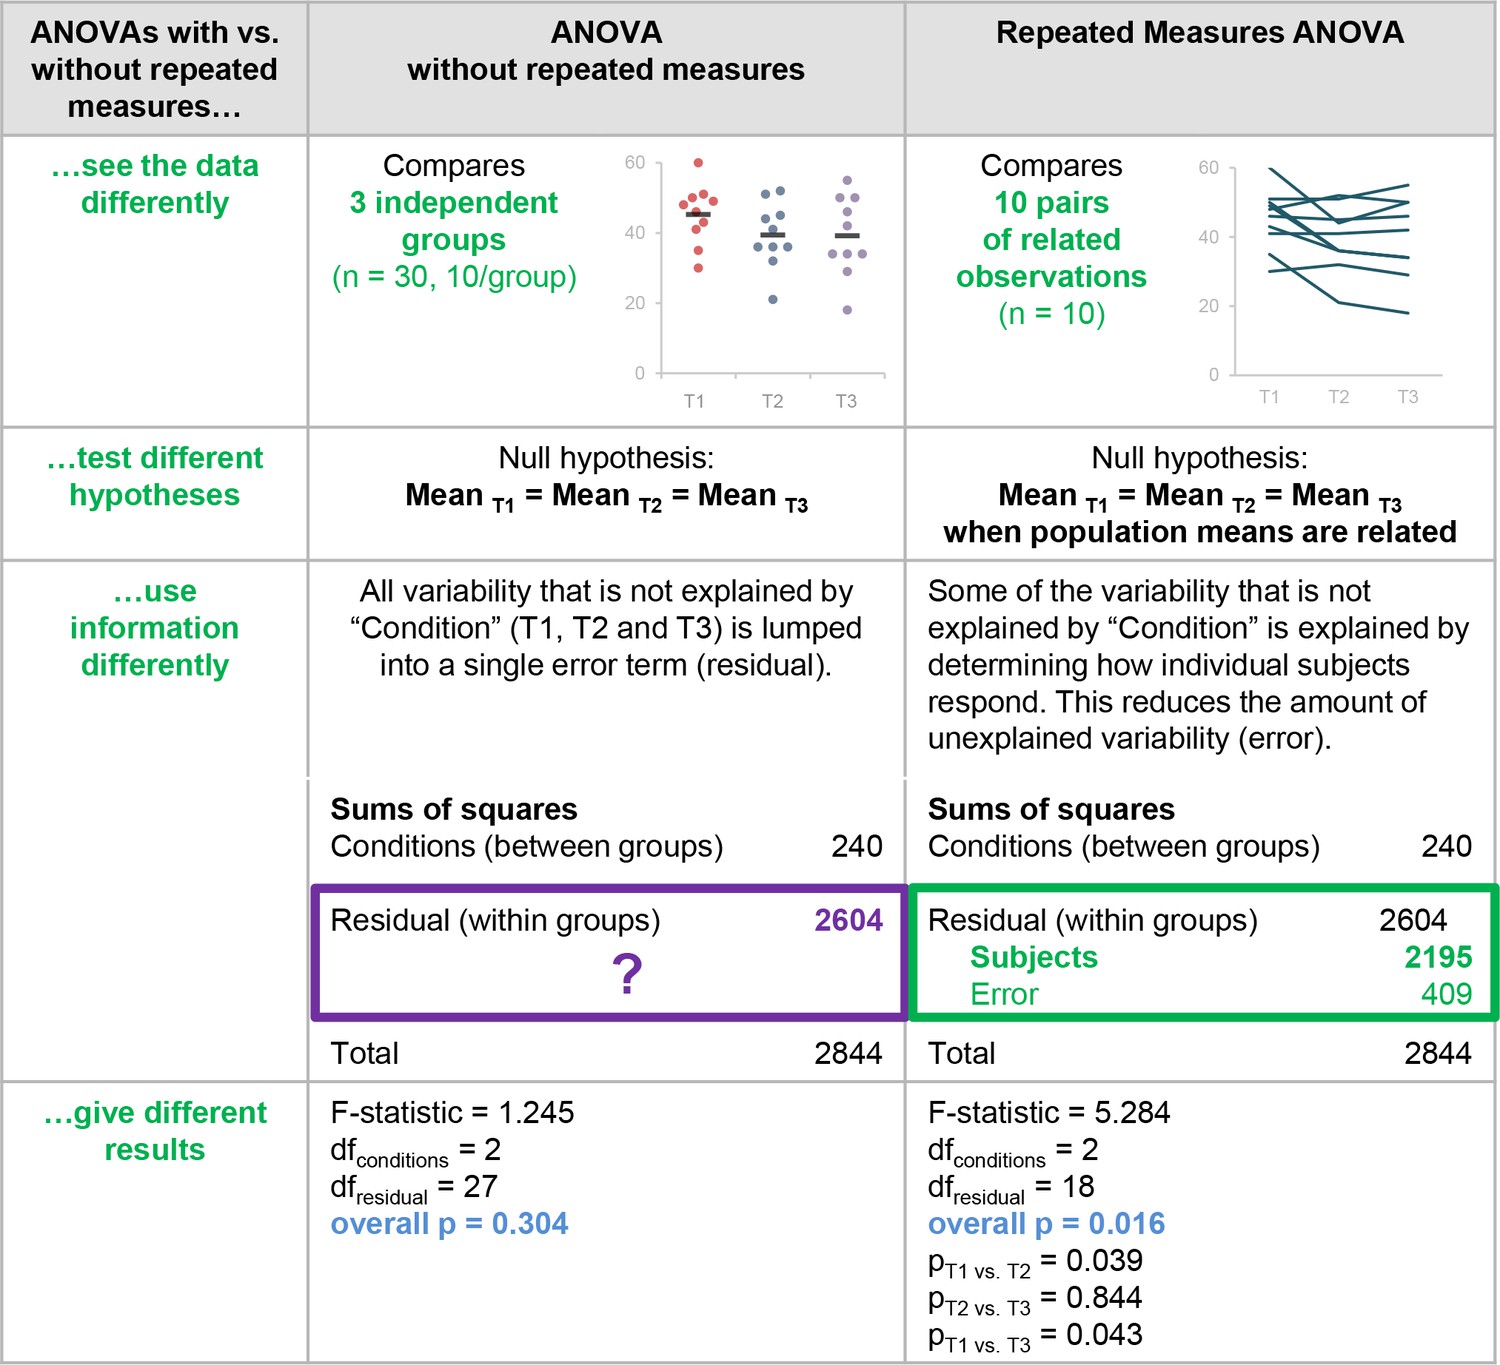
- ANOVA power analysis calculates the sample size required to detect differences among three or more means with a specified level of confidence and power
- Used when comparing means across multiple groups or levels of a factor (treatments, conditions)
Analyzing Relationships and Associations
- Regression power analysis determines the sample size needed to detect a specified effect size (strength of relationship) between a predictor variable and a response variable with a given level of confidence and power
- Estimates the minimum sample size required to achieve a desired level of statistical power for a regression model
- Chi-square power analysis calculates the sample size required to detect a specified effect size (strength of association) between two categorical variables with a given level of confidence and power
- Commonly used for analyzing contingency tables and testing independence between categorical variables (survey responses, demographic categories)
Power Analysis Software
GPower
- G*Power is a free, standalone power analysis program for a variety of statistical tests
- Provides a graphical user interface for inputting parameters and calculating power or sample size
- Supports t-tests, ANOVA, regression, chi-square, and other common statistical analyses
- Offers both a priori and post hoc power analysis options
- Generates detailed output, including effect size measures and graphical displays of power curves
Timing of Power Analysis
Planning and Design Stage
- A priori power analysis is conducted before data collection to determine the sample size needed to achieve a desired level of statistical power
- Helps researchers design studies with sufficient power to detect meaningful effects
- Requires specifying the desired power level (usually 0.80 or higher), significance level (alpha), and expected effect size
- Ensures that the study is adequately powered and resources are allocated efficiently
After Data Collection
- Post hoc power analysis is performed after data collection to determine the achieved power given the observed effect size and sample size
- Useful for interpreting non-significant results and assessing the likelihood of Type II errors (false negatives)
- Provides information about the adequacy of the sample size and the sensitivity of the study to detect effects
- Sensitivity analysis explores how changes in input parameters (effect size, alpha level) affect the power or required sample size
- Helps researchers understand the robustness of their power calculations and identify factors that have the greatest impact on power