R is a powerful tool for data journalists, offering robust statistical analysis and stunning visualizations. It enables you to import, clean, and analyze diverse datasets, from CSV files to web APIs, using functions and packages like dplyr and tidyr.
With R, you can create compelling graphics using ggplot2 and interactive visualizations with packages like plotly. It integrates seamlessly with other tools, supporting reproducible workflows through R Markdown and version control systems like Git.
R Programming Fundamentals
Basic Concepts and Environment
- R is an open-source programming language and software environment for statistical computing and graphics, providing a wide variety of statistical and graphical techniques
- R uses a command-line interface, where users type commands or submit scripts to perform tasks
- Integrated development environments (IDEs) such as RStudio can enhance the user experience by providing a more user-friendly interface and additional features
Data Structures and Operations
- R has several built-in data structures:
- Vectors: one-dimensional arrays that can contain numeric, character, or logical data
- Matrices: two-dimensional arrays with rows and columns, containing data of the same type
- Data frames: two-dimensional structures with rows and columns, similar to tables in a relational database, that can store data of different types in columns
- Lists: ordered collections of objects that can contain elements of different types, including other lists
- R uses a variety of operators for arithmetic, comparison, and logical operations
- R provides functions for data manipulation, statistical analysis, and graphical visualization
- R supports user-defined functions, which allow users to create custom operations and automate repetitive tasks
- R includes control structures such as loops and conditionals for more advanced programming
Statistical Analysis in R
Built-in Functions and Packages
- R provides a wide range of built-in functions for statistical analysis:
- Summary statistics functions: mean(), median(), sd() (standard deviation), and summary() for generating descriptive statistics of data
- Hypothesis testing functions: t.test() for t-tests, aov() for analysis of variance (ANOVA), and chisq.test() for chi-squared tests
- Regression analysis functions: lm() for linear regression and glm() for generalized linear models
- R has a vast collection of packages (libraries) that extend its functionality and provide additional tools for specific statistical methods and domains
- Packages can be installed from CRAN (Comprehensive R Archive Network) or other repositories using the install.packages() function
- Popular packages for data manipulation and analysis include dplyr, tidyr, and data.table, while ggplot2 is widely used for data visualization
Data Preprocessing and Modeling Techniques
- R provides functions for data preprocessing:
- Handling missing values: is.na() for identifying missing values, na.omit() for removing rows with missing values
- Scaling and normalization: scale() for standardizing variables
- Data splitting: sample() for random sampling, split() for dividing data into subsets
- R supports various statistical modeling techniques:
- Linear models, generalized linear models, and mixed-effects models through built-in functions and packages
- Survival analysis for modeling time-to-event data
- R offers a range of machine learning algorithms:
- Classification methods: decision trees, random forests, support vector machines
- Clustering methods: k-means, hierarchical clustering
- Machine learning packages such as caret and mlr provide a unified interface for training and evaluating models
Data Visualization with R
Base R Graphics and ggplot2
- R is renowned for its powerful and flexible graphics capabilities, enabling users to create a wide variety of static and interactive visualizations
- The base R graphics system provides a set of high-level functions for creating plots:
- plot() for scatterplots, line() for line graphs, hist() for histograms, and boxplot() for box plots
- These functions can be customized using additional arguments to control aspects such as colors, labels, axes, and legends
- Multiple plots can be arranged in a single figure using the par() function or layout() for more complex arrangements
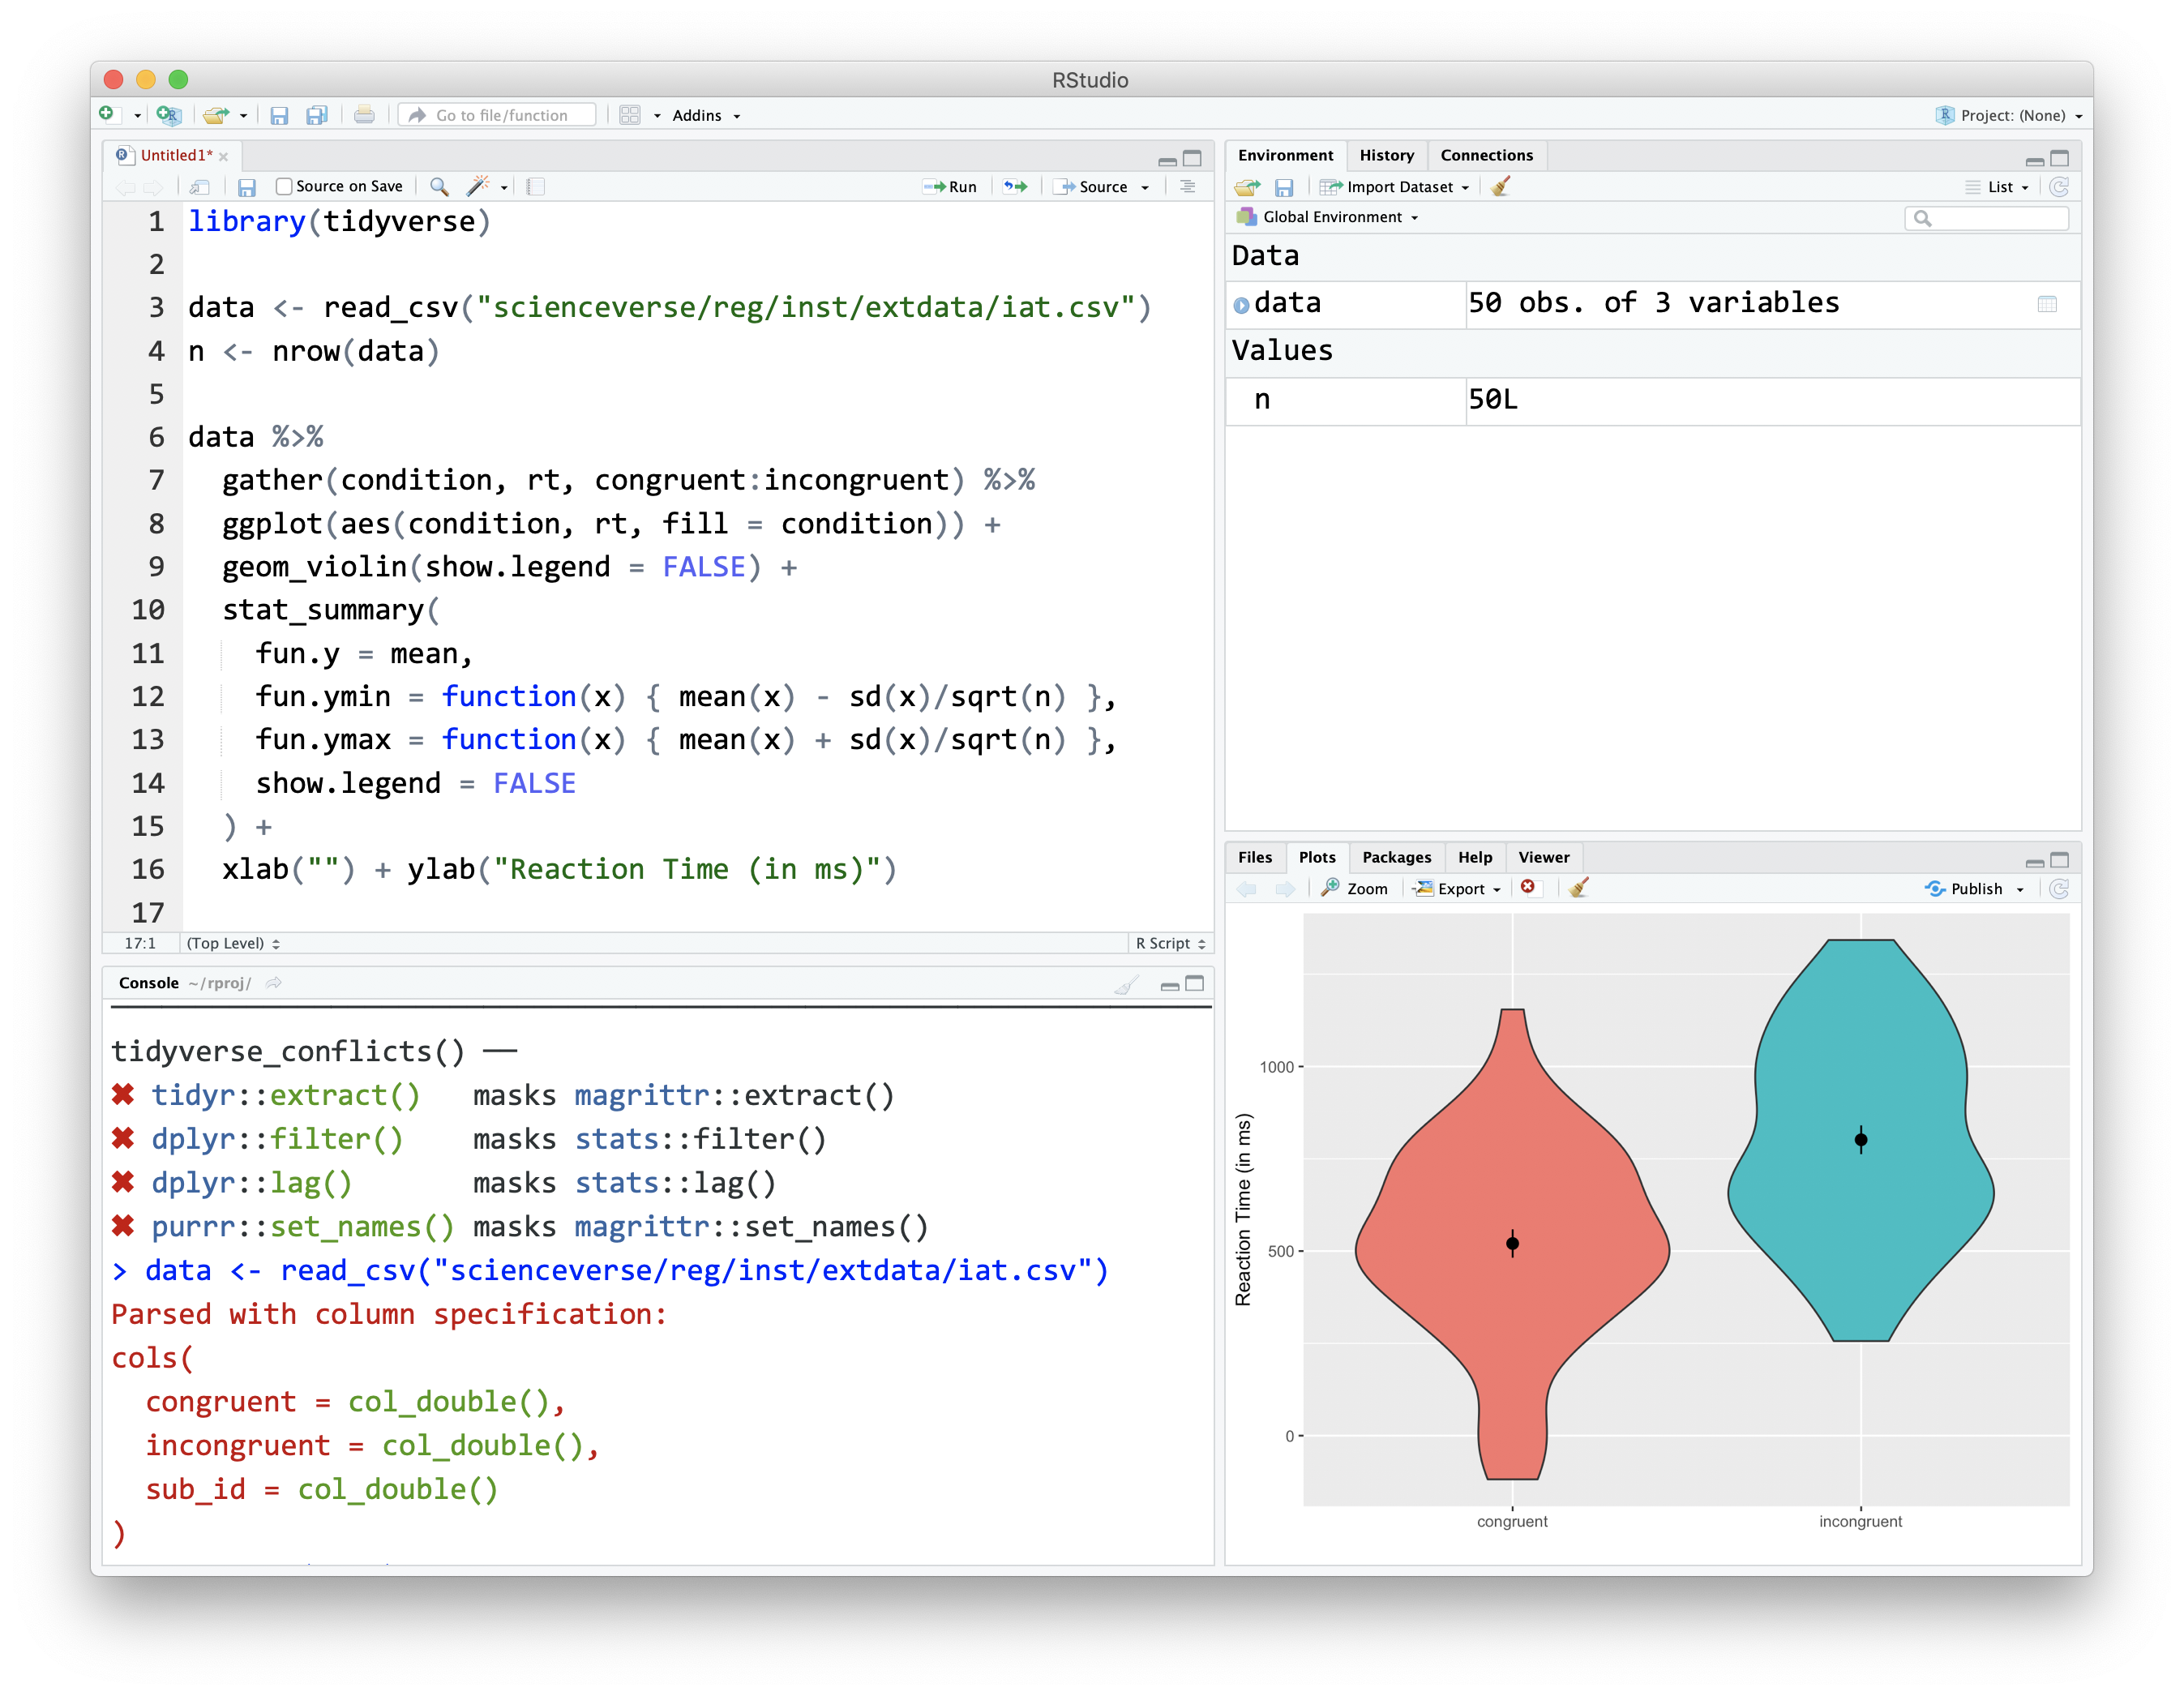
- The ggplot2 package, part of the tidyverse collection, is a popular and powerful tool for creating advanced and customizable graphics in R using a layered grammar of graphics
- ggplot2 uses a declarative approach, where users specify the data, aesthetic mappings (x and y axes, color, size), geometries (points, lines, bars), and other plot elements in a step-by-step manner
- ggplot2 supports a wide range of plot types (scatterplots, line plots, bar plots, histograms, box plots) and extensions for specific domains (maps, networks, time series)
Interactive Visualizations and Reporting
- R supports the creation of interactive and dynamic visualizations using packages such as plotly, leaflet (for maps), and shiny (for web applications)
- R can generate publication-quality graphics in various file formats, including PNG, JPEG, PDF, and SVG, using functions like png(), jpeg(), pdf(), and svg()
- R integrates with other tools for data visualization and reporting:
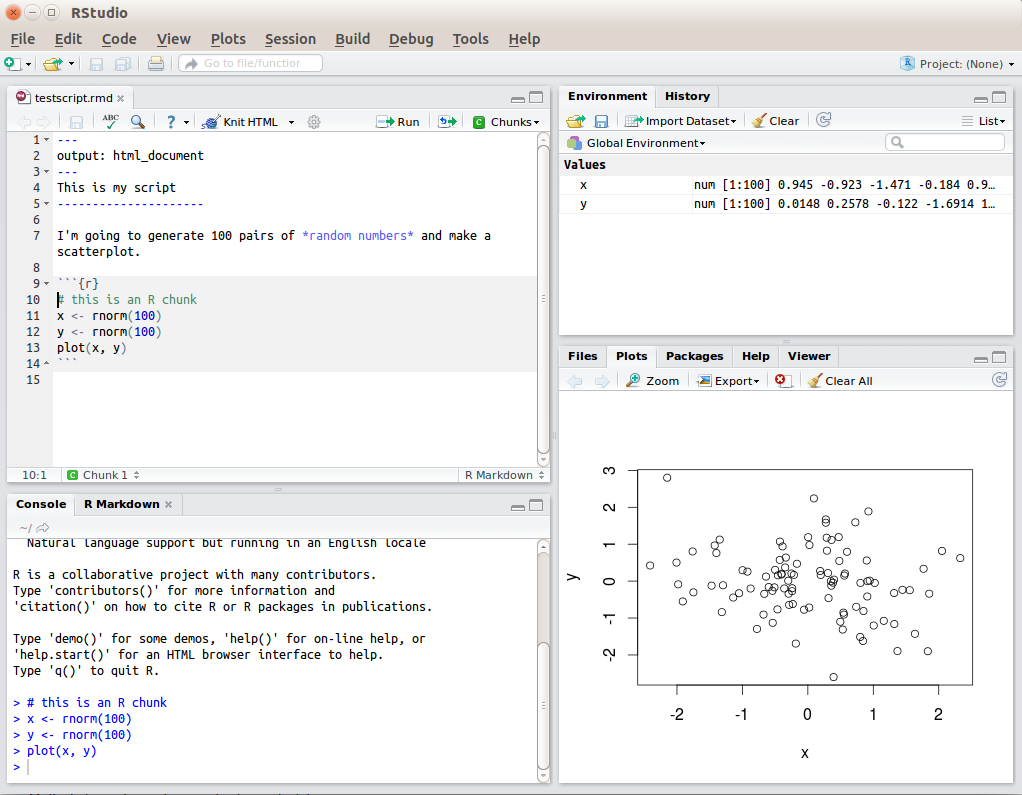
- Markdown and LaTeX through packages like rmarkdown and knitr, enabling the creation of dynamic and reproducible reports and presentations
- Web development frameworks for creating interactive data-driven stories
R for Data Journalism
Data Acquisition and Cleaning
- R is a powerful tool for data journalism, enabling journalists to collect, clean, analyze, and visualize data to support their stories and investigations
- R can import data from various sources:
- CSV files using read.csv()
- Excel spreadsheets using the readxl package
- Databases using packages like RMySQL and RPostgreSQL
- Web APIs using packages such as httr and jsonlite
- R provides functions and packages for data cleaning and preprocessing:
- dplyr and tidyr packages allow users to filter, select, mutate, and reshape data using a consistent and readable syntax
- dplyr functions like filter(), select(), mutate(), and summarise() enable users to subset, transform, and aggregate data efficiently
- tidyr functions such as pivot_longer() and pivot_wider() help in reshaping data between long and wide formats, making it easier to analyze and visualize
Analysis, Visualization, and Reproducibility
- R's statistical analysis capabilities enable journalists to explore and test hypotheses, identify patterns and trends, and build models to support their stories
- Journalists can use R to calculate summary statistics, perform hypothesis tests, and conduct regression analysis to identify relationships between variables
- R's machine learning packages allow journalists to build predictive models and classify data (identifying patterns in campaign contributions, predicting election outcomes)
- R's data visualization tools, such as ggplot2 and interactive visualization packages, enable journalists to create compelling and informative graphics to communicate their findings to a broad audience
- R integrates with other tools in the data journalism workflow:
- SQL databases for data storage
- Version control systems like Git for collaboration and reproducibility
- Web development frameworks for creating interactive data-driven stories
- R supports the creation of reproducible and transparent data journalism projects through tools like R Markdown and Jupyter Notebooks, which combine code, results, and narrative text in a single document, enabling others to verify and build upon the work