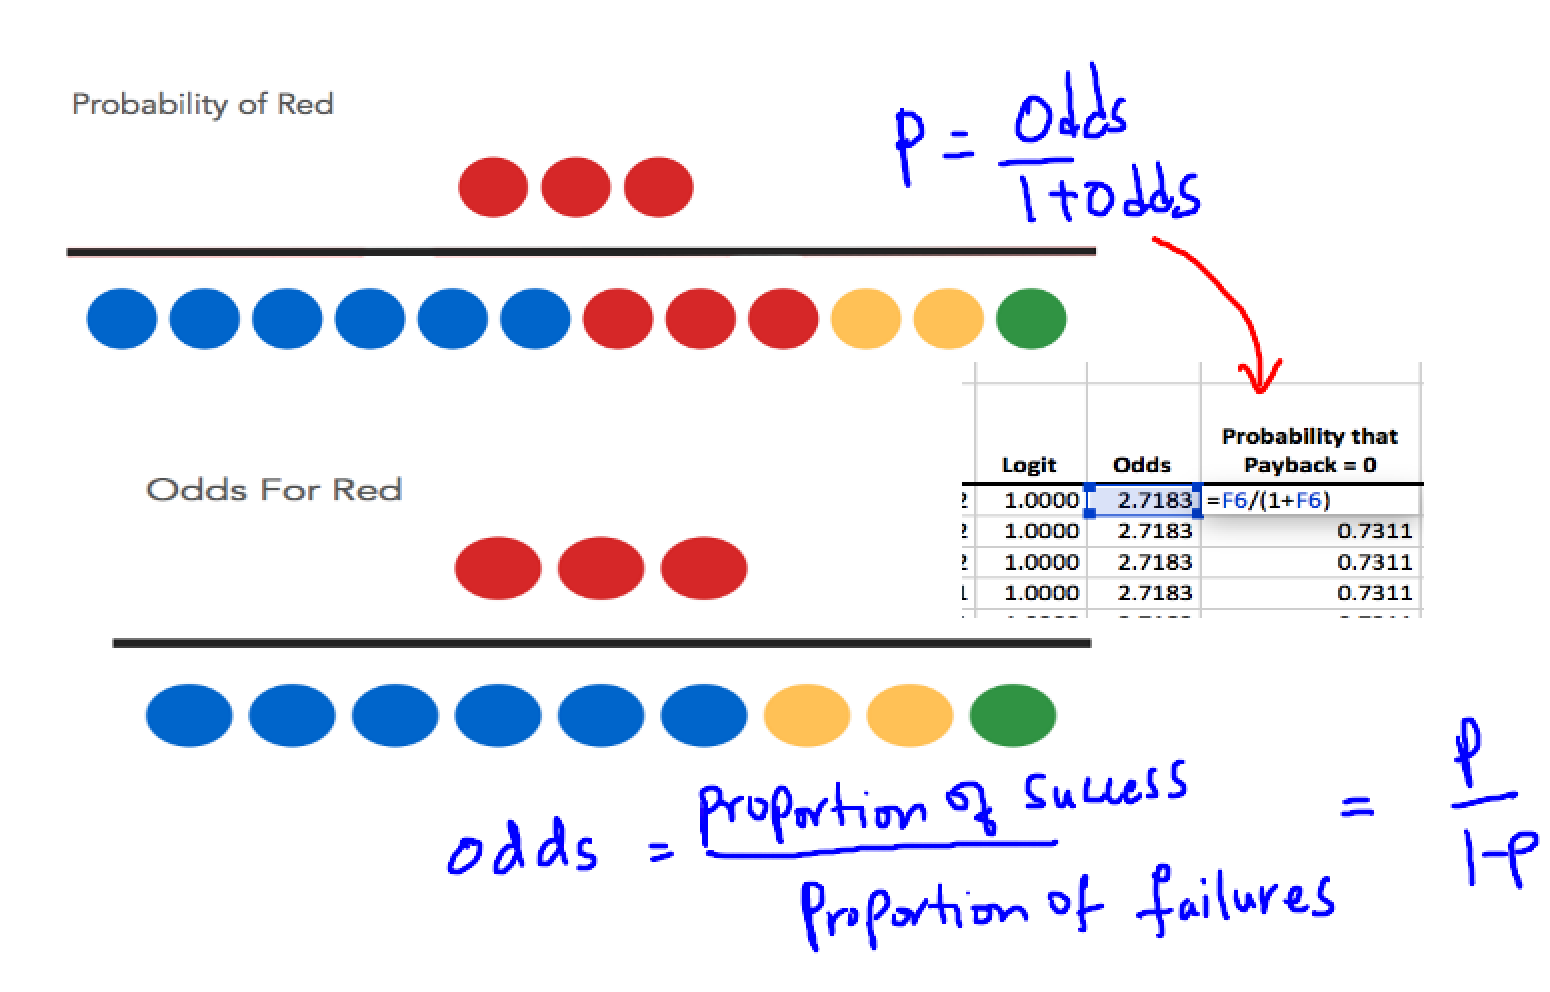
Odds ratios are a key tool in , helping us understand how variables affect the likelihood of an outcome. They show the change in odds when a predictor increases by one unit, making it easier to compare different factors' impacts.

Confidence intervals for odds ratios give us a range of possible true values, helping assess the precision and significance of our findings. By using odds ratios and their confidence intervals, we can rank predictors, examine interactions, and make practical decisions based on our analysis.

Odds Ratios in Logistic Regression

Interpreting Odds Ratios

Top images from around the web for Interpreting Odds Ratios
  • Odds ratios represent the change in odds of the outcome for a one-unit increase in the predictor variable, holding other variables constant
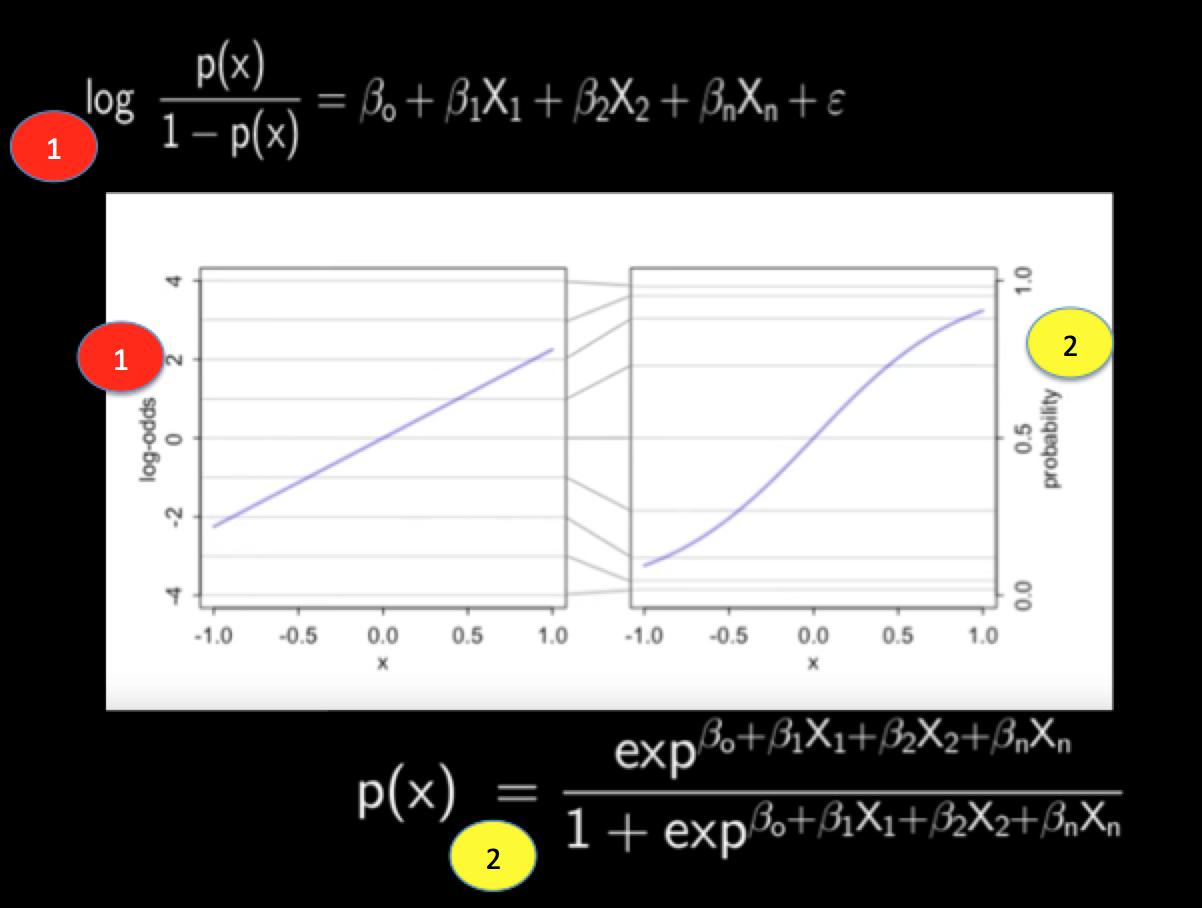
  • In logistic regression, the equals the exponentiated coefficient (e^β) for a given predictor variable
  • Odds ratio greater than 1 indicates an increased likelihood of the outcome, while less than 1 indicates a decreased likelihood
  • Interpret odds ratios as percentage changes in odds by subtracting 1 from the odds ratio and multiplying by 100
    • Example: Odds ratio of 1.5 means a 50% increase in odds
    • Example: Odds ratio of 0.75 means a 25% decrease in odds
  • Null value for an odds ratio equals 1, indicating no association between the predictor and the outcome
  • Odds ratios have multiplicative properties, allowing combination of effects from multiple predictors by multiplying their individual odds ratios
    • Example: If predictor A has an odds ratio of 1.5 and predictor B has an odds ratio of 2, their combined effect would be 1.5 * 2 = 3

Mathematical Properties of Odds Ratios

  • Calculate odds ratios using the formula: OR=eβOR = e^β
    • β represents the logistic regression coefficient
  • Odds ratios range from 0 to positive infinity
    • OR = 1 indicates no effect
    • 0 < OR < 1 indicates a negative association
    • OR > 1 indicates a positive association
  • Logarithm of odds ratios produces the logistic regression coefficient
    • ln(OR)=βln(OR) = β
  • Inverse relationship between odds ratios for binary predictors
    • Example: If the odds ratio for males compared to females is 2, the odds ratio for females compared to males is 1/2

Confidence Intervals for Odds Ratios

Calculating Confidence Intervals

  • Confidence intervals for odds ratios provide a range of plausible values for the true population odds ratio
  • Formula for calculating the for an odds ratio: CI_{95%} = e^{(β ± 1.96 * SE(β))}
    • β represents the logistic regression coefficient
    • SE(β) denotes its standard error
  • Lower bound of the confidence interval: LowerCI=e(β1.96SE(β))Lower_{CI} = e^{(β - 1.96 * SE(β))}
  • Upper bound of the confidence interval: UpperCI=e(β+1.96SE(β))Upper_{CI} = e^{(β + 1.96 * SE(β))}
  • Wider confidence intervals indicate less precision in the estimate, while narrower intervals suggest more precise estimates
    • Example: CI of (1.2, 1.8) is more precise than CI of (0.9, 2.5)

Interpreting Confidence Intervals

  • Confidence interval including 1 suggests the association between the predictor and outcome lacks at the chosen level
    • Example: CI of (0.8, 1.2) includes 1, indicating a non-significant association
  • Interpret confidence intervals considering both statistical significance and practical importance
    • Example: CI of (1.01, 1.05) might be statistically significant but have limited practical importance
  • Use confidence intervals to compare the strength of associations between different predictors and the outcome
    • Example: Predictor A with CI (1.5, 2.5) shows a stronger association than Predictor B with CI (1.1, 1.3)
  • Narrower confidence intervals generally indicate more reliable estimates
    • Example: CI of (1.8, 2.2) provides more confidence in the estimate than CI of (1.5, 2.5)

Quantifying Associations with Odds Ratios

Comparing Predictor Importance

  • Odds ratios allow comparison of the relative importance of different predictors in a logistic regression model
  • Magnitude of the odds ratio indicates the strength of the association between a predictor and the binary outcome
  • Rank predictors based on their impact on the outcome, with larger deviations from 1 indicating stronger associations
    • Example: OR of 3.5 for smoking vs. OR of 1.2 for age suggests smoking has a stronger association with lung cancer
  • For continuous predictors, the odds ratio represents the change in odds for a one-unit increase in the predictor
    • Example: OR of 1.05 for age means 5% increase in odds for each year increase in age
  • For categorical predictors, the odds ratio compares the odds of the outcome for one category relative to a reference category
    • Example: OR of 2.5 for college graduates compared to high school graduates in predicting job success

Examining Interactions

  • Investigate interactions between predictors by including interaction terms in the model and interpreting their corresponding odds ratios
  • Interaction odds ratio represents how the effect of one predictor changes across levels of another predictor
    • Example: OR of 1.5 for the interaction between gender and treatment indicates the treatment effect differs by gender
  • Interpret main effects and interaction effects together to understand the full relationship between predictors and the outcome
  • Visualize interactions using plots of predicted probabilities or odds ratios across different levels of interacting variables
    • Example: Plot treatment effect separately for males and females to illustrate gender interaction

Practical Significance of Odds Ratios

Communicating Odds Ratios

  • Translate odds ratios into easily understandable language, such as "X times more likely" or "Y% increase in odds"
    • Example: OR of 2.5 for smoking translates to "Smokers are 2.5 times more likely to develop lung cancer"
  • Provide context for the magnitude of odds ratios by comparing them to other known risk factors or benchmarks in the field
    • Example: Compare the OR for a new drug to the OR of existing treatments
  • Use visual aids, such as forest plots or odds ratio charts, to display odds ratios and their confidence intervals for multiple predictors
    • Example: Create a forest plot showing ORs and CIs for age, gender, and smoking status in predicting heart disease

Interpreting Practical Implications

  • Explain limitations of odds ratios, including their inability to provide information about absolute risk or causality
  • Discuss practical implications of the odds ratios in terms of decision-making, resource allocation, or intervention strategies
    • Example: An OR of 3 for a modifiable risk factor might suggest prioritizing interventions targeting that factor
  • Address potential confounding factors and emphasize the importance of considering other variables when interpreting odds ratios
  • Consider the baseline risk when interpreting the practical significance of an odds ratio
    • Example: An OR of 2 for a rare outcome might have less practical importance than an OR of 1.5 for a common outcome
  • Evaluate the cost-effectiveness and feasibility of interventions based on the magnitude of odds ratios
    • Example: A large OR for an easily modifiable risk factor might suggest a high-impact, low-cost intervention

Key Terms to Review (18)

95% confidence interval: A 95% confidence interval is a statistical range, derived from sample data, that is expected to contain the true population parameter with a probability of 95%. This means that if we were to take many samples and build a confidence interval from each one, approximately 95% of those intervals would capture the true value of the parameter being estimated. This concept is essential in making inferences about populations based on sample statistics, particularly in the context of odds ratios and confidence intervals.
Alternative hypothesis: The alternative hypothesis is a statement that suggests there is an effect or a difference in a statistical analysis, opposing the null hypothesis which posits no effect or difference. This hypothesis serves as the basis for testing, guiding researchers in determining whether their findings support the existence of an effect or difference worth noting.
Clinical Trials: Clinical trials are research studies performed on human participants to evaluate the effectiveness and safety of medical interventions, such as drugs, devices, or treatment protocols. These trials follow a strict protocol and are essential for determining how well a treatment works, what side effects may occur, and how it compares to existing options. The data collected from clinical trials significantly influences healthcare decisions, regulatory approvals, and can extend to various fields such as finance and marketing through the understanding of consumer behavior related to health products.
Cochran-Mantel-Haenszel test: The Cochran-Mantel-Haenszel test is a statistical method used to assess the association between two categorical variables while controlling for one or more additional categorical variables. This test is especially useful in stratified analyses, allowing researchers to determine if there is a consistent relationship across different groups or strata. By controlling for confounding factors, this test can provide a clearer insight into the true relationship between the primary variables of interest.
Confidence level: The confidence level is a statistical measure that indicates the probability that a confidence interval contains the true population parameter. It is often expressed as a percentage, such as 90%, 95%, or 99%, which reflects how confident we are in our estimate. A higher confidence level means a wider confidence interval, suggesting more certainty about the parameter being estimated.
Confounding Variables: Confounding variables are extraneous factors that may influence both the independent and dependent variables in a study, potentially leading to incorrect conclusions about the relationships being examined. These variables can create misleading associations, obscuring the true effects of the independent variable on the dependent variable. Identifying and controlling for confounding variables is crucial in ensuring the validity of experimental results and observational studies.
Control Group: A control group is a baseline group in an experiment that does not receive the treatment or intervention being tested. Instead, it serves as a comparison point against which the effects of the treatment on the experimental group can be measured. The control group helps to isolate the impact of the independent variable and ensures that any observed effects are due to the treatment rather than other factors.
Effect Size: Effect size is a quantitative measure that reflects the magnitude of a phenomenon or the strength of a relationship in statistics. It helps in understanding how significant a difference is between groups, providing context beyond p-values alone. This concept is crucial when determining sample sizes, evaluating hypotheses, assessing error rates, conducting analyses, and interpreting odds ratios and confidence intervals.
Epidemiological studies: Epidemiological studies are research investigations that analyze the patterns, causes, and effects of health and disease conditions in defined populations. These studies help public health officials understand how diseases spread, risk factors involved, and the overall health outcomes in communities. They often utilize statistical methods to quantify relationships and inform preventive measures, making connections to concepts like odds ratios and confidence intervals critical for interpreting results.
Exposure group: An exposure group is a subset of individuals in a study or experiment who have been exposed to a specific risk factor or treatment, which allows researchers to analyze the effects of that exposure on various outcomes. This concept is crucial for understanding how different exposures can influence health and behaviors, particularly when examining relationships between variables like disease prevalence and risk factors.
Independence Assumption: The independence assumption refers to the presumption that the observations or measurements in a statistical analysis are independent of one another. This concept is crucial as it allows for valid inference and generalizations to be made from sample data to the broader population. When this assumption holds true, the outcomes of one observation do not influence another, which is essential for accurately testing hypotheses and estimating parameters.
Likelihood Ratio: The likelihood ratio is a statistical measure that quantifies the odds of a particular outcome under two different hypotheses. It compares the probability of observing the data given a specific hypothesis versus the probability of observing the same data under an alternative hypothesis. This measure is crucial in assessing model performance and determining how well a test can differentiate between two conditions, linking it to evaluation metrics and inferential statistics.
Logistic regression: Logistic regression is a statistical method used for binary classification that models the relationship between a dependent binary variable and one or more independent variables. This technique estimates the probability that a given input point belongs to a particular category, allowing for predictions based on the relationship identified in the data. It plays a vital role in various applications across different fields by providing interpretable coefficients and an effective way to assess outcomes based on predictors.
Margin of Error: Margin of error is a statistical term that quantifies the uncertainty in survey results, indicating the range within which the true population parameter is expected to lie. It reflects how much the sample results may differ from the actual population values, allowing for more informed decision-making based on sample data.
Null hypothesis: The null hypothesis is a statement that assumes there is no effect or no difference in a given context, serving as a starting point for statistical testing. It helps researchers determine if observed data deviates significantly from what would be expected under this assumption. By establishing this baseline, it facilitates the evaluation of whether any changes or differences in data can be attributed to a specific factor or if they occurred by chance.
Odds Ratio: The odds ratio is a measure of association between an exposure and an outcome, quantifying the odds of an event occurring in one group relative to another. It is particularly useful in evaluating the strength of the relationship between a predictor variable and a binary outcome, making it essential in various statistical analyses, including regression models and assessments of correlation.
Sample Size: Sample size refers to the number of observations or data points collected in a study to estimate characteristics of a larger population. A well-chosen sample size is crucial as it affects the precision of estimates, the power of statistical tests, and the reliability of conclusions drawn from the data. Larger sample sizes generally lead to more reliable results, but they also require more resources and time for collection.
Statistical significance: Statistical significance is a measure that helps determine whether the results of a study or experiment are likely to be true and not due to chance. It provides a way to evaluate whether the observed effects in data can be confidently attributed to a specific factor or treatment, rather than random variability. This concept plays a crucial role in hypothesis testing, correlation analysis, estimation processes, and assessing the validity of regression models.
© 2024 Fiveable Inc. All rights reserved.
AP® and SAT® are trademarks registered by the College Board, which is not affiliated with, and does not endorse this website.