Tree diagrams and tables are powerful tools for visualizing probability outcomes. They help break down complex scenarios into manageable parts, making it easier to calculate and understand the likelihood of different events occurring.
These visual aids are especially useful for multi-stage experiments. By mapping out all possible outcomes, we can more easily identify the sample space and calculate probabilities for specific events or combinations of events.
Probability with Tree Diagrams and Tables
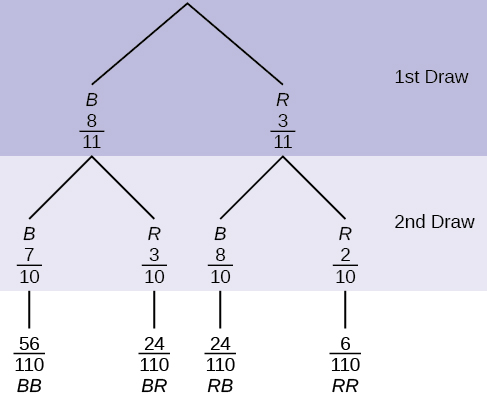
Tree diagrams for probability outcomes
- Visually represent possible outcomes of a probability experiment
- Branches represent possible outcomes (coin flip - heads or tails)
- Probabilities written along each branch (heads - 0.5, tails - 0.5)
- Create by identifying first event and listing all possible outcomes
- For each outcome, identify second event and list possible outcomes
- Continue for all subsequent events (first flip - heads or tails, second flip - heads or tails)
- Multiply probabilities along each path to find probability of specific outcome (multiplication rule)
- Two heads in a row: 0.5 × 0.5 = 0.25
- Sum of probabilities of all outcomes equals 1
- Ensures all possible outcomes accounted for
- Validates tree diagram construction

Tables for independent event combinations
- Organize and display all possible combinations of two independent events
- Rows represent outcomes of one event (die roll - 1, 2, 3, 4, 5, 6)
- Columns represent outcomes of other event (coin flip - heads, tails)
- Construct by listing outcomes of first event in first column
- List outcomes of second event in first row
- Fill in cells with corresponding outcome combinations (1 and heads, 1 and tails, etc.)
- Total number of combinations is product of number of outcomes for each event
- Die (6 outcomes) and coin (2 outcomes): 6 × 2 = 12 total combinations
- Helps visualize and count all possible combinations systematically
Sample space in multi-stage experiments
- Set of all possible outcomes of a probability experiment
- Multi-stage experiments include all combinations of outcomes from each stage
- List using tree diagram by following each path from start to end
- Each complete path represents one outcome (coin flip then die roll: heads and 1, heads and 2, etc.)
- List using table by considering each cell as one outcome
- Each unique row-column pair is an outcome in the sample space
- Number of outcomes equals product of number of outcomes at each stage
- Two-stage experiment with 2 outcomes in first stage and 3 in second: 2 × 3 = 6 outcomes
- Crucial for calculating probabilities and understanding scope of experiment
Additional Probability Concepts
- Conditional probability: Probability of an event occurring given that another event has already occurred
- Mutually exclusive events: Events that cannot occur simultaneously
- Venn diagram: Graphical representation of set relationships, useful for visualizing probability concepts
- Addition rule: Used to calculate the probability of either one event or another occurring