Hypothesis testing is a crucial tool in communication research, allowing researchers to draw conclusions about populations from sample data. It provides a systematic approach to validate theories and minimize the influence of chance in findings.
The process involves formulating hypotheses, selecting significance levels, and choosing appropriate test statistics. Researchers must navigate potential errors, interpret statistical significance, and consider limitations to draw meaningful conclusions about communication phenomena.
Fundamentals of hypothesis testing
- Hypothesis testing forms the foundation of quantitative research methods in communication studies
- Allows researchers to make inferences about populations based on sample data
- Crucial for testing theories and validating communication models
Definition and purpose
- Statistical method to draw conclusions about population parameters from sample data
- Tests the plausibility of a specific hypothesis about a population characteristic
- Helps researchers make decisions about accepting or rejecting hypotheses based on evidence
- Provides a systematic approach to minimize the influence of chance in research findings
Null vs alternative hypotheses
- Null hypothesis (H0) states no effect or relationship exists between variables
- Alternative hypothesis (H1 or Ha) proposes a specific effect or relationship
- Researchers aim to gather evidence to reject the null hypothesis
- Failure to reject H0 does not prove it true, only indicates insufficient evidence to disprove it
- Alternative hypotheses can be directional (one-tailed) or non-directional (two-tailed)
Types of hypotheses
- Research hypothesis expresses the expected relationship between variables
- Statistical hypothesis translates research hypothesis into mathematical statements
- Directional hypothesis specifies the expected direction of the relationship (positive or negative)
- Non-directional hypothesis predicts a relationship without specifying its direction
- Null hypothesis always states no effect or relationship (equality)
Steps in hypothesis testing
- Hypothesis testing follows a structured process in communication research
- Ensures consistency and reliability in statistical analysis
- Allows for replication and validation of research findings
Formulating the hypothesis
- Define the research question based on theory or previous studies
- State the null hypothesis (H0) and alternative hypothesis (H1)
- Ensure hypotheses are clear, specific, and testable
- Operationalize variables to make them measurable
- Consider potential confounding variables and control methods
Selecting significance level
- Choose the alpha (α) level, typically 0.05 or 0.01 in communication research
- Represents the probability of rejecting a true null hypothesis (Type I error)
- Lower α levels (0.01) are more conservative than higher levels (0.05)
- Consider the consequences of Type I and Type II errors in the research context
- Balance between minimizing false positives and maximizing statistical power
Choosing test statistic
- Select appropriate test based on research design and data characteristics
- Consider the level of measurement (nominal, ordinal, interval, ratio)
- Determine if data meets assumptions for parametric or non-parametric tests
- Common test statistics in communication research include t, F, chi-square, and r
- Calculate the test statistic using sample data and relevant formulas
Determining critical region
- Identify the critical value(s) based on the chosen significance level and degrees of freedom
- Use statistical tables or software to find the critical value
- Compare the calculated test statistic to the critical value(s)
- Reject H0 if the test statistic falls in the critical region (rejection region)
- Critical region depends on whether the test is one-tailed or two-tailed
Types of errors
- Errors in hypothesis testing can lead to incorrect conclusions in communication research
- Understanding these errors helps researchers interpret results more accurately
- Balancing different types of errors is crucial for robust research design
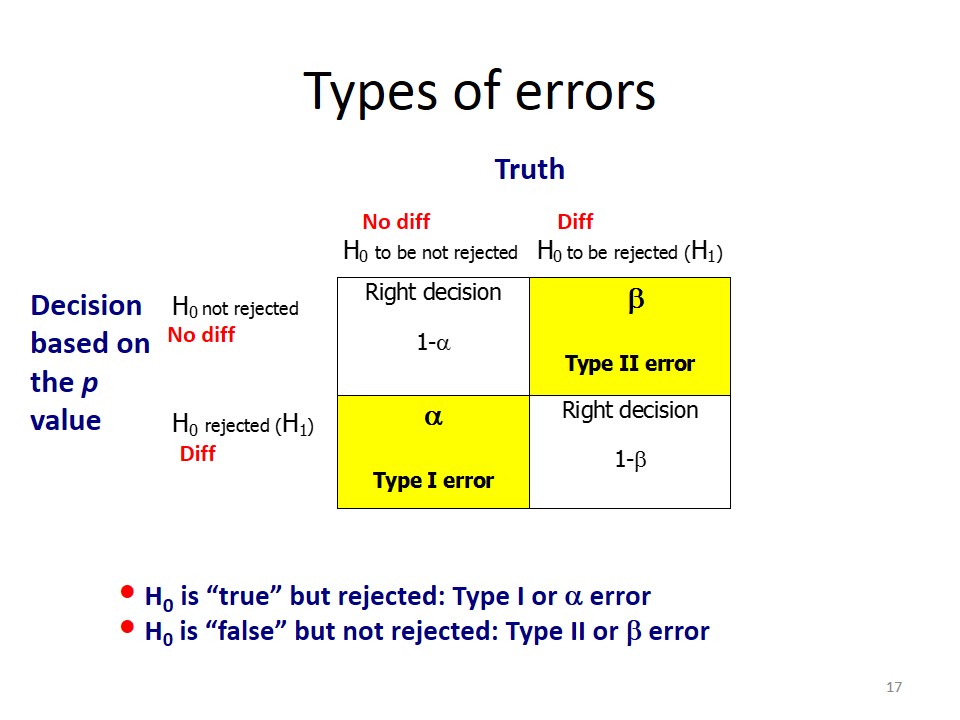
Type I error
- Occurs when rejecting a true null hypothesis (false positive)
- Probability of Type I error equals the chosen significance level (α)
- More serious in some contexts (medical diagnoses, legal decisions)
- Can lead to erroneous conclusions about communication phenomena
- Controlled by setting a lower significance level (0.01 instead of 0.05)
Type II error
- Happens when failing to reject a false null hypothesis (false negative)
- Probability of Type II error is denoted by β
- Often considered less serious than Type I error in many research contexts
- Can result in overlooking significant communication effects or relationships
- Influenced by sample size, effect size, and chosen significance level
Power of a test
- Ability of a statistical test to detect a true effect or relationship
- Calculated as 1 - β (probability of correctly rejecting a false null hypothesis)
- Increases with larger sample sizes and effect sizes
- Typically aim for power of 0.80 or higher in communication research
- Can be improved by increasing sample size or using more sensitive measures
Statistical significance
- Central concept in hypothesis testing for communication research
- Helps researchers determine if observed effects are likely due to chance
- Provides a standardized way to interpret and report research findings
P-value interpretation
- Probability of obtaining the observed (or more extreme) results if the null hypothesis is true
- Smaller p-values indicate stronger evidence against the null hypothesis
- Compare p-value to the predetermined significance level (α)
- Reject H0 if p-value < α, fail to reject if p-value ≥ α
- Does not indicate the magnitude or practical importance of an effect
Confidence intervals
- Range of values likely to contain the true population parameter
- Typically reported as 95% or 99% confidence intervals
- Wider intervals indicate less precise estimates
- Non-overlapping confidence intervals suggest significant differences between groups
- Provide more information than simple p-values about effect magnitude and precision
Effect size
- Quantifies the magnitude of the observed effect or relationship
- Independent of sample size, unlike p-values
- Common measures include Cohen's d, Pearson's r, and eta-squared
- Helps assess practical significance in addition to statistical significance
- Essential for meta-analyses and comparing results across studies
Common hypothesis tests
- Various statistical tests are used in communication research depending on the research question and data type
- Selecting the appropriate test is crucial for valid results and interpretations
- Researchers should understand the assumptions and limitations of each test
T-test
- Compares means between two groups or conditions
- Independent samples t-test for separate groups (comparing two different audiences)
- Paired samples t-test for repeated measures (pre-test vs post-test scores)
- Assumes normal distribution and homogeneity of variance
- Reports t-statistic, degrees of freedom, and p-value
ANOVA
- Analysis of Variance compares means across three or more groups
- One-way ANOVA for single independent variable (comparing multiple message types)
- Factorial ANOVA for multiple independent variables and their interactions
- Reports F-statistic, degrees of freedom, and p-value
- Post-hoc tests (Tukey's HSD) identify specific group differences
Chi-square test
- Analyzes relationships between categorical variables
- Goodness-of-fit test compares observed frequencies to expected frequencies
- Independence test examines associations between two categorical variables
- Assumes expected frequencies are sufficiently large (typically > 5)
- Reports χ² statistic, degrees of freedom, and p-value
Correlation analysis
- Measures the strength and direction of relationships between variables
- Pearson's r for interval/ratio data, assumes linear relationship
- Spearman's rho for ordinal data or non-linear relationships
- Values range from -1 to +1, indicating negative or positive correlations
- Reports correlation coefficient (r or ρ) and p-value
Assumptions in hypothesis testing
- Statistical tests rely on certain assumptions about the data
- Violating these assumptions can lead to inaccurate results or interpretations
- Researchers must check and address assumption violations in communication studies
Normality
- Assumes data follows a normal distribution (bell-shaped curve)
- Assessed using visual methods (Q-Q plots, histograms) or statistical tests (Shapiro-Wilk)
- Mild violations often tolerated for large sample sizes (n > 30)
- Transformation techniques can address non-normality (log, square root)
- Non-parametric tests as alternatives when normality assumption is severely violated
Homogeneity of variance
- Assumes equal variances across groups or conditions
- Tested using Levene's test or Bartlett's test
- Important for t-tests and ANOVA to ensure valid comparisons
- Welch's t-test or Brown-Forsythe F-test as alternatives for unequal variances
- Violation can lead to increased Type I error rates or reduced statistical power
Independence of observations
- Assumes each data point is independent of others
- Crucial for accurate p-values and confidence intervals
- Violated in repeated measures designs or clustered sampling
- Addressed through specialized statistical techniques (mixed-effects models)
- Random sampling and proper experimental design help ensure independence
Limitations and criticisms
- Hypothesis testing has faced various criticisms in the scientific community
- Understanding these limitations is crucial for responsible use in communication research
- Researchers should consider alternative approaches and interpret results cautiously

Misuse of p-values
- Overreliance on p < 0.05 as a marker of "truth" or importance
- P-hacking: manipulating data or analyses to achieve significant results
- Ignoring effect sizes and practical significance in favor of statistical significance
- Misinterpreting non-significant results as proof of no effect
- Encourages binary thinking (significant vs. non-significant) rather than nuanced interpretation
Sample size issues
- Small samples lead to low statistical power and unreliable results
- Large samples can make trivial effects statistically significant
- Difficulty in obtaining adequate sample sizes in some communication contexts
- Need for a priori power analysis to determine appropriate sample sizes
- Importance of reporting effect sizes alongside significance tests
Multiple comparisons problem
- Increased risk of Type I errors when conducting multiple tests
- Family-wise error rate grows with each additional comparison
- Methods to address (Bonferroni correction, False Discovery Rate)
- Can lead to overly conservative results if not properly handled
- Importance of pre-registering analyses to avoid post-hoc fishing expeditions
Reporting results
- Clear and accurate reporting of statistical results is essential in communication research
- Follows standardized formats to ensure consistency and reproducibility
- Helps readers understand and evaluate the strength of evidence
APA format for statistics
- American Psychological Association (APA) style widely used in communication journals
- Report test statistic, degrees of freedom, p-value, and effect size
- Use italics for test statistics (t, F, χ²) and lowercase for p
- Round to two decimal places (except for p-values less than .001)
- Include descriptive statistics (means, standard deviations) alongside inferential tests
Interpreting test outcomes
- Clearly state whether the null hypothesis was rejected or not rejected
- Avoid language of "proving" hypotheses; focus on evidence strength
- Discuss both statistical significance and practical significance (effect sizes)
- Consider results in the context of previous research and theoretical predictions
- Address any unexpected findings or limitations of the analysis
Communicating findings
- Translate statistical results into plain language for non-technical audiences
- Use visual aids (graphs, charts) to illustrate key findings
- Discuss implications of results for theory, practice, and future research
- Address potential alternative explanations for observed effects
- Emphasize the cumulative nature of scientific evidence rather than single study results
Advanced concepts
- More complex statistical techniques expand the toolkit for communication researchers
- Allow for more nuanced analyses and handling of various data types
- Require careful consideration of assumptions and interpretations
One-tailed vs two-tailed tests
- One-tailed tests examine effects in a single direction (positive or negative)
- Two-tailed tests consider effects in both directions
- One-tailed tests have more statistical power but require strong directional hypotheses
- Two-tailed tests are more conservative and widely accepted in communication research
- Choice depends on research question, prior evidence, and potential consequences of errors
Parametric vs non-parametric tests
- Parametric tests assume normally distributed data and interval/ratio measurement
- Non-parametric tests make fewer assumptions about data distribution and level of measurement
- Parametric tests (t-test, ANOVA) generally have more statistical power
- Non-parametric alternatives (Mann-Whitney U, Kruskal-Wallis) for violated assumptions
- Choice depends on data characteristics, sample size, and research goals
Bayesian hypothesis testing
- Alternative framework to traditional null hypothesis significance testing
- Uses prior probabilities and observed data to update beliefs about hypotheses
- Provides probability distributions for parameters rather than point estimates
- Allows for direct comparison of competing hypotheses
- Growing in popularity but requires different interpretation and reporting practices
Applications in communication research
- Hypothesis testing is widely used across various subfields of communication studies
- Helps researchers systematically investigate communication phenomena
- Enables empirical testing of theories and models in diverse contexts
Media effects studies
- Examine causal relationships between media exposure and audience outcomes
- Use experimental designs to test hypotheses about media influence
- Apply t-tests or ANOVA to compare effects across different media conditions
- Correlation analysis to explore associations between media use and attitudes
- Regression techniques to control for confounding variables in survey research
Persuasion research
- Investigate factors influencing attitude change and behavior
- Test hypotheses about message characteristics, source credibility, and audience factors
- Use pre-post designs with paired t-tests to measure attitude shifts
- ANOVA to compare effectiveness of different persuasive strategies
- Mediation analysis to explore mechanisms of persuasive effects
Interpersonal communication
- Examine patterns and outcomes of face-to-face and mediated interactions
- Test hypotheses about communication styles, relationship satisfaction, and conflict
- Use correlation analysis to explore associations between communication behaviors
- Apply multilevel modeling for dyadic data in relationship research
- Conduct longitudinal analyses to track changes in communication patterns over time