analysis expands on simple linear regression by incorporating multiple predictors. It's a powerful tool for understanding complex relationships between variables, allowing us to model real-world scenarios more accurately.

In this section, we'll cover the basics of multiple regression, including model components, interpretation, and evaluation. We'll also dive into significance testing and residual analysis to ensure our models are robust and reliable.

Multiple Regression Fundamentals

Understanding Multiple Regression Components

Top images from around the web for Understanding Multiple Regression Components
  • Multiple regression analyzes relationships between one and two or more independent variables
  • Dependent variable represents the outcome or effect being studied in the regression model
  • Independent variables act as predictors or explanatory factors influencing the dependent variable
  • (OLS) estimates by minimizing the sum of squared
    • Residuals measure the difference between observed and predicted values
    • OLS produces unbiased and efficient estimators under certain assumptions

Interpreting Regression Equations

  • General form of multiple regression equation: Y=β0+β1X1+β2X2+...+βkXk+εY = β₀ + β₁X₁ + β₂X₂ + ... + βₖXₖ + ε
    • Y represents the dependent variable
    • X₁, X₂, ..., Xₖ denote independent variables
    • β₀ is the y- (value of Y when all X's are zero)
    • β₁, β₂, ..., βₖ are regression coefficients indicating the effect of each X on Y
    • ε represents the error term capturing unexplained variation
  • measure the change in Y for a one-unit increase in X, holding other variables constant
  • allow comparison of relative importance among independent variables

Evaluating Model Fit

Assessing Overall Model Performance

  • () measures the proportion of variance in Y explained by all X variables collectively
    • Ranges from 0 to 1, with higher values indicating better fit
    • Calculated as: R2=1(SSE/SST)R² = 1 - (SSE / SST)
      • SSE: Sum of Squared Errors
      • SST: Total Sum of Squares
  • penalizes the addition of irrelevant predictors to the model
    • Accounts for the number of independent variables and sample size
    • Useful for comparing models with different numbers of predictors
  • quantifies the average deviation of observed Y values from the regression line
    • Smaller values indicate more accurate predictions
    • Calculated as: Se=(YY^)2nk1S_e = \sqrt{\frac{\sum (Y - Ŷ)²}{n - k - 1}}
      • Ŷ represents predicted Y values
      • n is the sample size
      • k is the number of independent variables
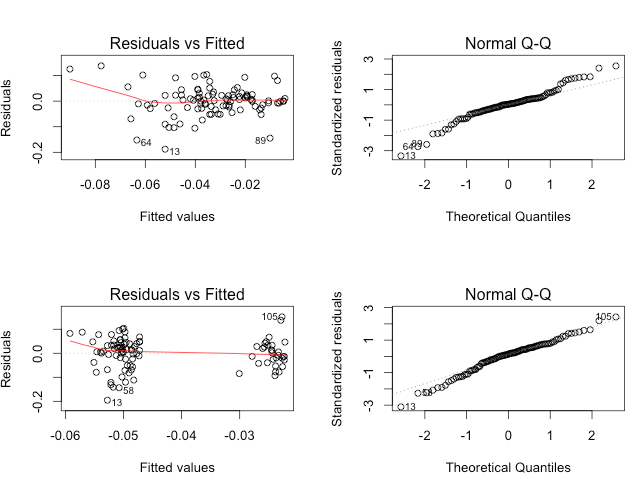
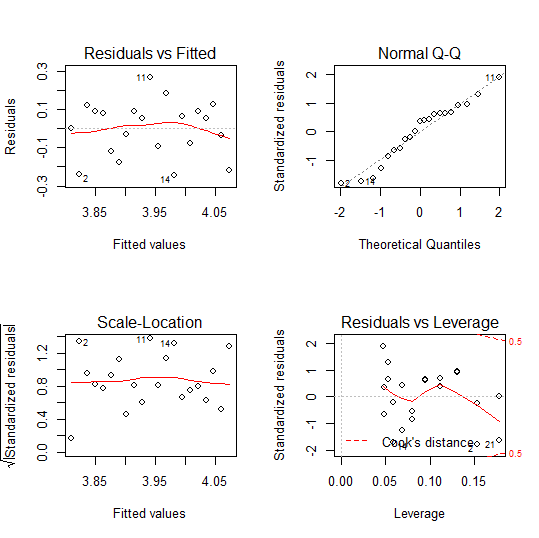
Analyzing Residuals

  • Residuals represent the difference between observed and predicted values of the dependent variable
  • Plotting residuals helps identify patterns or violations of regression assumptions
  • Residual analysis includes examining:
    • (using histograms or Q-Q plots)
    • (constant variance of residuals)
    • (absence of autocorrelation)
  • and can be detected through residual analysis

Significance Testing

Assessing Overall Model Significance

  • tests the overall significance of the regression model
    • Null hypothesis: All regression coefficients are simultaneously zero
    • Alternative hypothesis: At least one coefficient is non-zero
  • F-statistic calculation: F=MSRMSEF = \frac{MSR}{MSE}
    • MSR:
    • MSE:
  • Large F-values and small p-values indicate a significant overall model

Evaluating Individual Predictor Significance

  • T-statistic measures the significance of individual regression coefficients
    • Calculated as: t=βiSE(βi)t = \frac{β_i}{SE(β_i)}
      • β_i is the estimated coefficient
      • SE(β_i) is the standard error of the coefficient
  • T-statistic follows a t-distribution with (n - k - 1) degrees of freedom
  • represents the probability of obtaining the observed t-statistic under the null hypothesis
    • Small p-values (typically < 0.05) indicate statistically significant predictors
  • Confidence intervals for coefficients can be constructed using t-statistics and standard errors

Key Terms to Review (31)

Adjusted r-squared: Adjusted r-squared is a statistical measure that provides an adjusted version of the traditional r-squared value, which indicates the proportion of variance in the dependent variable that can be explained by the independent variables in a regression model. Unlike r-squared, adjusted r-squared accounts for the number of predictors in the model, penalizing excessive use of variables that do not contribute significantly to explaining variability. This adjustment helps in evaluating the model's performance, especially when comparing models with different numbers of predictors.
Coefficient of determination: The coefficient of determination, often represented as $$R^2$$, measures the proportion of variance in the dependent variable that can be predicted from the independent variable(s) in a regression model. It provides insights into the goodness of fit of the model, indicating how well the regression line approximates the real data points. A higher value of $$R^2$$ signifies that a greater proportion of variance is explained by the model, highlighting its predictive accuracy.
Cross-sectional data: Cross-sectional data refers to data collected at a single point in time across multiple subjects or entities. This type of data is useful for analyzing relationships and patterns among different variables, providing a snapshot view that can be used in various statistical techniques, including forecasting and regression analysis.
Dependent Variable: A dependent variable is the outcome or response that is measured in an experiment or statistical analysis, which is influenced by one or more independent variables. In regression analysis, understanding how changes in the independent variable(s) affect the dependent variable is crucial for making predictions and drawing conclusions about relationships between variables.
F-statistic: The f-statistic is a value that arises from the analysis of variance (ANOVA) used to compare the fits of different statistical models, particularly in multiple regression analysis. It assesses whether at least one predictor variable has a statistically significant relationship with the response variable, helping to determine the overall significance of the model. A higher f-statistic indicates a more reliable model, suggesting that the independent variables collectively explain a significant portion of the variance in the dependent variable.
F-test: An f-test is a statistical test used to determine if there are significant differences between the variances of two or more groups. It plays a crucial role in multiple regression analysis, as it helps to evaluate the overall significance of the regression model by comparing the model’s variance explained by the independent variables to the unexplained variance.
Financial modeling: Financial modeling is the process of creating a mathematical representation of a company's financial performance, often using historical data to forecast future financial outcomes. This process typically involves building spreadsheets that outline revenues, expenses, and profits, while incorporating various scenarios and assumptions to analyze potential business decisions and investments.
Homoscedasticity: Homoscedasticity refers to the property of a dataset where the variance of the errors or residuals is constant across all levels of the independent variable(s). This concept is crucial because it ensures that the regression model provides reliable estimates and valid statistical inferences, impacting the accuracy of linear and nonlinear trend models, assumptions in regression, and forecasting accuracy.
Independence of residuals: Independence of residuals refers to the assumption that the residuals, or the differences between observed and predicted values in a regression analysis, should not show any patterns or correlations with each other. This assumption is crucial in multiple regression analysis as it ensures that the model is capturing all the systematic information in the data, allowing for accurate predictions and valid statistical inferences.
Independent Variable: An independent variable is a factor that is manipulated or changed in an experiment or analysis to observe its effect on a dependent variable. It serves as the input or cause in regression models, helping to explain the variation in the outcome of interest. Understanding independent variables is crucial for establishing relationships in statistical methods and forecasting.
Influential observations: Influential observations are data points in a statistical analysis that significantly affect the results of the model, particularly in regression analysis. These observations can disproportionately influence the slope of the regression line or the fit of the model, potentially leading to misleading conclusions. Identifying and understanding these observations is crucial for ensuring the accuracy and reliability of multiple regression results.
Intercept: In statistical modeling, the intercept is the value of the dependent variable when all independent variables are equal to zero. It serves as a starting point for the regression line or curve, providing a baseline from which changes in the dependent variable can be measured as the independent variables change. The intercept is crucial for understanding the relationship between variables in various types of models, helping to inform predictions and insights derived from the data.
Mean Square Error: Mean Square Error (MSE) is a statistical measure that quantifies the average squared difference between the predicted values and the actual values in a regression model. It serves as a key indicator of how well a model performs, providing insight into the accuracy of the predictions made by the model. A lower MSE indicates a better fit of the model to the data, making it crucial in evaluating multiple regression analysis.
Mean Square Regression: Mean square regression is a statistical measure used to assess the goodness of fit of a regression model by comparing the variability explained by the model to the total variability in the data. It is calculated as the ratio of the regression sum of squares to its degrees of freedom, and provides insights into how well the independent variables explain the dependent variable's variance.
Multiple regression: Multiple regression is a statistical technique that analyzes the relationship between one dependent variable and two or more independent variables. This method allows for the examination of how several factors simultaneously affect an outcome, making it a powerful tool in forecasting and predictive modeling.
Normality of residuals: Normality of residuals refers to the assumption that the residuals, or the differences between observed and predicted values, follow a normal distribution in multiple regression analysis. This assumption is crucial because it impacts the validity of statistical tests and the accuracy of the confidence intervals for the predicted values, thereby influencing overall model performance.
Ordinary Least Squares: Ordinary least squares (OLS) is a statistical method used for estimating the relationships between variables, particularly in the context of regression analysis. This technique minimizes the sum of the squares of the residuals, which are the differences between observed and predicted values. OLS is foundational in multiple regression analysis as it helps determine how well independent variables explain the variation in a dependent variable.
Outliers: Outliers are data points that significantly differ from the majority of a dataset, often lying outside the overall pattern. They can indicate variability in the measurement, errors in data collection, or a novel phenomenon worth investigating further. Understanding outliers is crucial as they can influence the results of regression analysis and impact the assumptions of statistical models.
P-value: The p-value is a statistical measure that helps determine the significance of results obtained in hypothesis testing. It quantifies the probability of obtaining test results at least as extreme as the observed results, assuming that the null hypothesis is true. A lower p-value indicates stronger evidence against the null hypothesis, playing a critical role in assessing the validity of regression models and understanding the relationships between variables in multiple regression analysis.
Partial regression coefficients: Partial regression coefficients are values that represent the relationship between each independent variable and the dependent variable in a multiple regression analysis while controlling for the effects of other independent variables. These coefficients help quantify how much a change in one independent variable affects the dependent variable, assuming all other variables remain constant, which is crucial for understanding the unique contribution of each predictor in the model.
R programming: R programming is a language and environment specifically designed for statistical computing and graphics. It's widely used for data analysis, allowing users to manipulate data, perform statistical tests, and create visualizations. Its open-source nature makes it a go-to tool for statisticians and data scientists, especially when dealing with complex datasets and model building.
R-squared: R-squared, also known as the coefficient of determination, is a statistical measure that represents the proportion of the variance for a dependent variable that's explained by an independent variable or variables in a regression model. It helps assess how well the model fits the data, indicating the strength and direction of a relationship between the variables. A higher r-squared value suggests a better fit and implies that the model explains a significant portion of the variability in the dependent variable.
Regression coefficients: Regression coefficients are the numerical values that represent the relationship between independent variables and the dependent variable in a regression model. They indicate how much the dependent variable is expected to change when one of the independent variables changes by one unit, while all other variables remain constant. Understanding these coefficients is crucial for interpreting the results of multiple regression analysis and assessing the strength and direction of relationships among variables.
Residuals: Residuals are the differences between observed values and the values predicted by a statistical model. They serve as an important measure of how well a model fits the data, as they indicate the errors made in predictions. A smaller residual means the model is doing a good job of predicting, while larger residuals suggest potential issues with the model’s accuracy or suitability.
Sales Forecasting: Sales forecasting is the process of estimating future sales volumes based on historical data, market trends, and various analytical methods. This practice helps businesses make informed decisions about inventory management, budgeting, and resource allocation by predicting customer demand accurately.
Slope: Slope is a measure of the steepness or incline of a line, typically represented as the ratio of the vertical change to the horizontal change between two points on a graph. It provides crucial insights into the relationship between variables, indicating how much one variable changes in relation to another. In various mathematical models, slope plays a vital role in understanding trends and making predictions about future values.
SPSS: SPSS, which stands for Statistical Package for the Social Sciences, is a software application used for statistical analysis and data management. It provides a user-friendly interface and a variety of tools that help users perform complex statistical operations, including multiple regression analysis, making it an essential tool for researchers and data analysts.
Standard Error of Estimate: The standard error of estimate is a statistical measure that quantifies the accuracy of predictions made by a regression model. It reflects the average distance that the observed values fall from the regression line, providing insight into how well the model predicts actual outcomes. A smaller standard error indicates that the model's predictions are closer to the actual data points, while a larger standard error suggests more variability and less reliability in the predictions.
Standardized coefficients: Standardized coefficients are statistical measures that indicate the strength and direction of the relationship between independent variables and a dependent variable in a regression model, expressed in standardized units. They allow for direct comparison of the relative importance of each predictor in contributing to the variation in the outcome, making it easier to assess which variables have the most significant impact on the dependent variable.
T-test: A t-test is a statistical method used to determine if there is a significant difference between the means of two groups, which may be related to certain features or treatments. It's particularly useful in multiple regression analysis when evaluating the significance of individual predictors in a model. This helps in understanding whether the relationship observed is likely due to chance or if it represents a real effect in the data being analyzed.
Time series data: Time series data refers to a sequence of data points collected or recorded at specific time intervals, enabling analysis of trends, patterns, and fluctuations over time. This type of data is crucial for forecasting as it allows analysts to identify underlying trends and seasonality, leading to more accurate predictions. It can be used to study various phenomena such as economic indicators, stock prices, or sales figures, providing valuable insights for decision-making.
© 2024 Fiveable Inc. All rights reserved.
AP® and SAT® are trademarks registered by the College Board, which is not affiliated with, and does not endorse this website.