Introduction
In this unit, we've discussed how a market is a social structure that brings together producers, AKA suppliers, and consumers, AKA demanders. We've also modeled their activity by using a demand curve for consumers and a supply curve for producers. However, we haven't actually modeled a market yet. This is because we have yet to bring consumers and producers together! This guide will go deep into how a market actually decides how much to produce and at what price.

What is Equilibrium in a Market?
Market equilibrium is a condition in a market where the quantity supplied equals the quantity demanded at an optimal price level. It is the point at which all of the quantity supplied is consumed by consumers who are willing and able to. This occurs where Qd = Qs, or where the demand curve intersects the supply curve (note that this is only ever one point, because demand is monotonically decreasing whereas supply is monotonically increasing).
This occurs as a result of voluntary exchange. Voluntary exchange is the act of consumers and firms mutually benefiting in the marketplace, as utility and profits are maximized.
When a market is in equilibrium, it is allocative efficient (when we are meeting the needs of society), and the sum of consumer and producer surplus, or total economic surplus, is maximized. This is shown by the graph below at the point where the quantity demanded equals quantity supplied (Q1).

Q1 and P1 are known as the equilibrium price and quantity for this market. When suppliers supply this quantity at this price, all of their quantity will be consumed by consumers in an efficient manner.
Consumer Surplus
Consumer surplus is the difference between the total amount that consumers are willing to pay for a good or service and the total amount that they actually pay. There are two types of consumer surplus:
- Individual consumer surplus is the difference between a buyer's maximum price (highest price that they are willing to pay for a good or service) and what the market price is.
| Buyer's Maximum Willingness to Pay | Individual Consumer Surplus |
|---|---|
| $12 | $4 |
| $11 | $3 |
| $10 | $2 |
| $9 | $1 |
| $8 | $0 |
In the table above, the left-hand column shows all the various prices that individuals are willing to pay for a particular good or service. The right-hand column shows you what their individual consumer surplus would be if they paid the equilibrium price, which in this situation is $8. So for example, someone who is willing to pay $12 and ends up paying 4 that they did not have to spend and this is a consumer surplus, or extra money, they have left to spend on something else.
- Total consumer surplus is all the individual consumer surpluses added together. This is identified on a supply and demand graph as the triangle above equilibrium price (the green area on the graph below). Total consumer surplus is always the triangle above the equilibrium price because it shows all the various prices above equilibrium that consumers would be willing to pay above the market price. For example, if an iPhone is selling for $300 (market price) there may be people willing to pay more than $300, which is demonstrated by all the different price points on the section of the demand curve that is above equilibrium price. We use consumer surplus on a graph to illustrate all the various prices people are willing to pay for an iPhone.

On the graph above, we show how we represent consumer surplus on a standard demand and supply graph. In many situations, consumers are willing to pay more for a good or service than what is being charged in the market, so we shade the triangle above equilibrium price that goes up to the demand curve.
💡 Use the triangle area formula from math to find the consumer surplus on a graph!
📈 For those of who are mathematically inclined and know some calculus, try seeing how you would find consumer surplus with non-linear supply and demand! Hint: You'll need to know how to integrate!

Producer Surplus
Producer surplus refers to the difference between the total amount that firms are willing and able to sell a good or service for and the total amount that they actually receive when selling it. Individual producer surplus is the difference between a firm's (seller's) minimum price and the equilibrium price that the good or service is sold for in the market.
- Individual producer surplus is the difference between a firm's (seller's) minimum price and the equilibrium price that the good or service is sold for in the market.Assume that the equilibrium price in the market is $9 per unit.
| Seller's Maximum Willingness to Pay | Individual Producer Surplus |
|---|---|
| $1 | $8 |
| $3 | $6 |
| $5 | $4 |
| $7 | $2 |
| $9 | $0 |
In the table above, the left-hand column shows all the various prices that firms are willing to sell their particular good or service for. The right-hand column shows you what their individual producer surplus would be if they paid the equilibrium price, which is $9. For example, if you were buying a car from a dealership, and they were willing to sell you the car for as low as $10,000, while you negotiate a price of $14,000, then they receive $4,000 more for the car than anticipated, which is their producer surplus.
- Total producer surplus is composed of all the individual producer surpluses added up. This is identified on a supply and demand graph as the triangle below equilibrium price (the blue area on the graph below). Typically, a firm has a lower than equilibrium price they are willing to accept for a product. If they receive a higher price, that becomes surplus for them. For example, when you walk into a clothing store and buy a pair of jeans for $25, most likely the firm could have sold that pair of jeans for a lower price and still made a profit. The amount they could have sold the jeans for is their minimum price (the price they are not willing to go below) and at $25 they received extra money above this price.

The graph above shows how we represent producer surplus on a demand and supply graph. Since producer surplus is the difference between what price the producer is willing to sell their product for and what they actually sell it for, we shade the area below equilibrium but above the supply curve.
💡Use the triangle area formula from math to find the producer surplus on a graph!
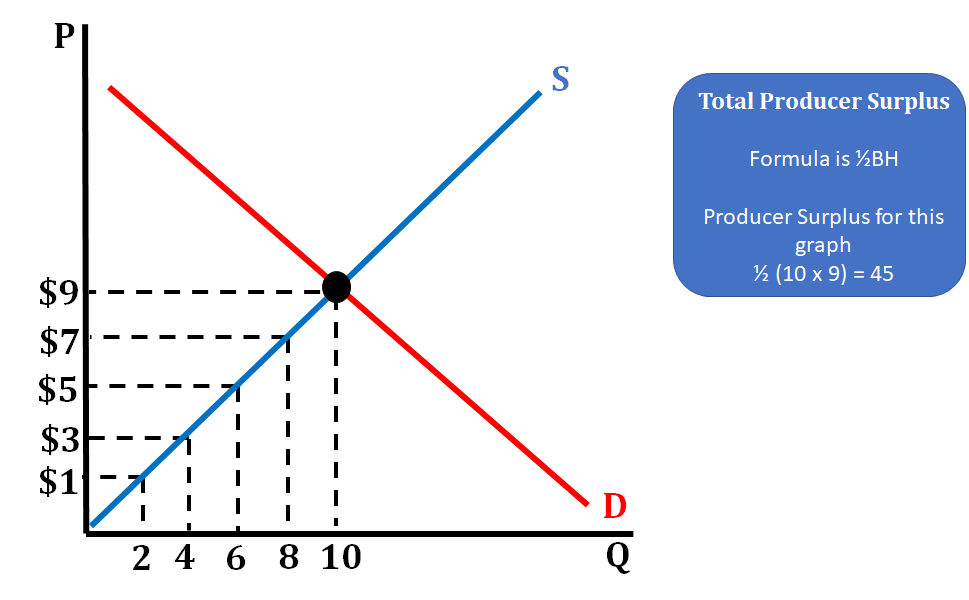
This graph shows a product with an equilibrium price of $9 and shows all the other prices firms are willing to sell the product for. This allows us to calculate how much the producer surplus is for this market, a task that is common on the AP exam. In economics, CS and PS allow us to measure the efficiency of a market and demonstrates the benefits that both producers and consumers receive.
Vocabulary
The following words are mentioned explicitly in the College Board Course and Exam Description for this topic.Term | Definition |
|---|---|
consumer surplus | The difference between the maximum price consumers are willing to pay for a good and the actual price they pay, representing the benefit consumers receive from purchasing at market price. |
equilibrium | The market condition where the quantity supplied equals the quantity demanded, resulting in a stable price with no tendency to change. |
equilibrium price | The price at which the quantity supplied equals the quantity demanded in a market. |
equilibrium quantity | The quantity of a good or service that is both supplied and demanded at the equilibrium price. |
market efficiency | A condition where perfectly competitive markets maximize total economic surplus in the absence of market failures. |
market equilibrium | The point where the quantity supplied equals the quantity demanded at a particular price, resulting in no shortage or surplus in the market. |
market failures | Situations where markets fail to allocate resources efficiently, preventing the maximization of total economic surplus. |
perfectly competitive markets | Markets characterized by many buyers and sellers, homogeneous products, free entry and exit, and perfect information where individual firms are price takers. |
producer surplus | The difference between the actual price received by a producer and the minimum price at which they are willing to supply a good, representing the benefit producers receive from selling at market price. |
quantity demanded | The amount of a good or service that consumers are willing and able to purchase at a given price. |
quantity supplied | The amount of a good or service that producers are willing and able to offer for sale at a specific price. |
supply-demand model | An economic tool used to understand the factors that influence prices and quantities in markets and explain price and quantity differences across markets or over time. |
total economic surplus | The sum of consumer surplus and producer surplus, representing the total benefit to society from market exchange. |
Frequently Asked Questions
What is market equilibrium and how do you find it on a graph?
Market equilibrium is the price and quantity where quantity demanded equals quantity supplied—the supply and demand curves cross. On a graph: label price (vertical) and quantity (horizontal), draw downward-sloping demand and upward-sloping supply, and mark the intersection. The price at that point is the equilibrium price (Pe); the quantity is the equilibrium quantity (Qe). Consumer surplus is the area above Pe and below the demand curve (a triangle from the highest willingness to pay down to Pe). Producer surplus is the area below Pe and above the supply curve (a triangle from Pe down to lowest acceptable price). You can calculate each triangle’s area as 0.5 × base (Qe) × height (difference in price). AP free-response tasks often ask you to draw and label these areas and compute them (see Skill 4.A graphing and MKT-4.A in the CED). For a quick review, check the topic study guide (https://library.fiveable.me/ap-microeconomics/unit-2/market-equilibrium-consumer-producer-surplus/study-guide/rT6VwtcikMj2QSanPBKu), the Unit 2 overview (https://library.fiveable.me/ap-microeconomics/unit-2), and practice problems (https://library.fiveable.me/practice/ap-microeconomics).
How do I calculate consumer surplus from a supply and demand graph?
Find the equilibrium price and quantity where demand and supply intersect. Consumer surplus (CS) is the area between the demand curve (buyers’ willingness to pay) and the market price, from 0 to the equilibrium quantity. On a typical linear demand curve that's a triangle, so: CS = 1/2 × base × height - base = equilibrium quantity (Qe) - height = maximum willingness to pay at Qe (the demand curve’s price intercept at that quantity) − equilibrium price (Pe) Example: if the demand price at Qe would be $20, Pe = $8, and Qe = 6, then CS = 1/2 × 6 × (20 − 8) = $36. This is exactly the kind of calculation the CED expects (MKT-4.A.3, MKT-4.A.4)—you’ll be asked to compute areas from graphs or tables on the exam. For more worked examples and AP-style practice, check the Topic 2.6 study guide (https://library.fiveable.me/ap-microeconomics/unit-2/market-equilibrium-consumer-producer-surplus/study-guide/rT6VwtcikMj2QSanPBKu), the Unit 2 overview (https://library.fiveable.me/ap-microeconomics/unit-2), and Fiveable’s practice problems (https://library.fiveable.me/practice/ap-microeconomics).
What's the difference between consumer surplus and producer surplus?
Consumer surplus (CS) and producer surplus (PS) are both measures of the benefits people get from market transactions, but from different sides. - Consumer surplus = the difference between what buyers are willing to pay (demand / marginal benefit) and what they actually pay (price). On a supply–demand graph it’s the triangular area above the market price and below the demand curve. - Producer surplus = the difference between the price sellers receive and their minimum acceptable price (supply / marginal cost). On the graph it’s the triangular area below the market price and above the supply curve. At equilibrium (where supply = demand) total economic surplus = CS + PS is maximized in a perfectly competitive market; deadweight loss appears when quantity deviates from equilibrium. On AP free-response you’ll be asked to draw these areas and calculate their sizes from graphs/tables (so practice finding triangle areas). For a quick review, check the Topic 2.6 study guide (https://library.fiveable.me/ap-microeconomics/unit-2/market-equilibrium-consumer-producer-surplus/study-guide/rT6VwtcikMj2QSanPBKu) and try practice problems (https://library.fiveable.me/practice/ap-microeconomics).
I don't understand why market equilibrium is supposed to be efficient - can someone explain?
Market equilibrium is “efficient” because at the equilibrium price and quantity (where demand = supply) total economic surplus—consumer surplus + producer surplus—is maximized. Graphically, every trade up to Q* has marginal benefit (height on demand) greater than or equal to marginal cost (height on supply), so buyers who value the good more than it costs to produce buy it, and sellers who can produce at or below that cost sell it. That means there are no remaining mutually beneficial trades left; moving quantity up or down creates deadweight loss (lost surplus). This result holds in a perfectly competitive market without market failures. On the AP exam you’ll need to show this with properly labeled graphs and calculate areas (surplus triangles)—practice those skills on the Topic 2.6 study guide (https://library.fiveable.me/ap-microeconomics/unit-2/market-equilibrium-consumer-producer-surplus/study-guide/rT6VwtcikMj2QSanPBKu) and try problems at (https://library.fiveable.me/practice/ap-microeconomics).
How do you know when a market clears and there are no shortages or surpluses?
A market “clears” when the equilibrium price makes quantity demanded equal quantity supplied—so there’s no excess demand (shortage) and no excess supply (surplus). On a supply-and-demand graph that’s the point where the demand curve intersects the supply curve. If price is above that intersection, quantity supplied > quantity demanded (surplus) and sellers cut price; if price is below it, quantity demanded > quantity supplied (shortage) and buyers bid the price up. In a perfectly competitive market, this equilibrium price/quantity balances buyers’ marginal benefit and sellers’ marginal cost and (absent market failures) maximizes total economic surplus (CED MKT-4.A.2, MKT-4.A.5). On the AP exam you’ll often need to show this on a labeled graph (Skill Category 4) and calculate consumer/producer surplus at equilibrium. For a quick review, see the Topic 2.6 study guide (https://library.fiveable.me/ap-microeconomics/unit-2/market-equilibrium-consumer-producer-surplus/study-guide/rT6VwtcikMj2QSanPBKu) and more Unit 2 resources (https://library.fiveable.me/ap-microeconomics/unit-2) or practice questions (https://library.fiveable.me/practice/ap-microeconomics).
What happens to consumer and producer surplus when equilibrium price changes?
If the equilibrium price changes, consumer surplus (CS) and producer surplus (PS) change because CS is the area under the demand curve above price and PS is the area above the supply curve below price. - Price rises (from a demand shift or supply decrease): CS falls (buyers pay more and fewer buy), PS typically rises per unit received but net PS change depends on quantity; equilibrium quantity usually falls. Total surplus may fall if the change is caused by a distortion (like a price floor) creating deadweight loss, but if the market simply moved to a new competitive equilibrium (supply or demand shifted), the new equilibrium still maximizes total surplus given those conditions. - Price falls (demand decrease or supply increase): CS rises (lower price, more consumer benefit) and PS falls; quantity usually changes too. You’ll often calculate CS and PS as triangle areas (½·base·height) on supply/demand graphs—a required skill on AP free-response (CED MKT-4.A). For walkthroughs and practice problems, check the Topic 2.6 study guide (https://library.fiveable.me/ap-microeconomics/unit-2/market-equilibrium-consumer-producer-surplus/study-guide/rT6VwtcikMj2QSanPBKu) and more practice at (https://library.fiveable.me/practice/ap-microeconomics).
Can you calculate producer surplus using the same triangle formula as consumer surplus?
Yes—in the usual AP Micro problems you can calculate producer surplus with the same triangle area formula you use for consumer surplus, but only when the surplus area is a triangle (which is what you see with linear supply/demand). Quick rules: - Producer surplus = area above the supply curve and below the market price, up to the equilibrium quantity. - If that area is a triangle (straight-line supply), use 1/2 × base × height. Base = equilibrium quantity (Qe). Height = price received (Pe) − minimum price sellers would accept at Qe (point on supply curve). - If the supply curve is non-linear, the exact producer surplus is the integral (area under price minus supply curve); AP free-response / CED expects you to calculate areas from graphs/tables, so most exam tasks use triangular or rectangular areas you can compute directly (see MKT-4.A in the CED). Practice more graphical calculations in the Topic 2.6 study guide (https://library.fiveable.me/ap-microeconomics/unit-2/market-equilibrium-consumer-producer-surplus/study-guide/rT6VwtcikMj2QSanPBKu) and try problems at (https://library.fiveable.me/practice/ap-microeconomics).
Why does equilibrium price help with resource allocation - I'm confused about this concept?
Equilibrium price helps allocate resources because it’s the signal that balances buyers’ marginal benefit with sellers’ marginal cost. At that price quantity demanded = quantity supplied, so the market “clears”—no surplus or shortage (CED MKT-4.A.2). Buyers who value the good more than the price buy it (consumer surplus), and sellers who can produce for less than the price sell (producer surplus). Because equilibrium maximizes total economic surplus (consumer + producer) in a perfectly competitive market, resources go to the uses that create the most net benefit (CED MKT-4.A.5, MKT-4.A.3). On the AP exam you’ll need to show this with correctly labeled graphs and calculate surplus areas (Topic 2.6). Want to practice drawing and calculating these areas? Check the Topic 2.6 study guide (https://library.fiveable.me/ap-microeconomics/unit-2/market-equilibrium-consumer-producer-surplus/study-guide/rT6VwtcikMj2QSanPBKu) and try problems from Fiveable’s practice set (https://library.fiveable.me/practice/ap-microeconomics).
What does it mean that perfectly competitive markets maximize total economic surplus?
It means that in a perfectly competitive market the market price and quantity (where supply = demand) set by equilibrium give the largest possible sum of consumer surplus + producer surplus—i.e., total economic surplus—so no mutually beneficial trades are left undone. Graphically, equilibrium maximizes the area between the demand curve (marginal benefit) and the supply curve (marginal cost). At any other quantity you create deadweight loss: either lost gains from trades if quantity is too low or wasted cost if quantity is too high. So equilibrium equates marginal benefit and marginal cost and allocates resources efficiently (CED MKT-4.A.2, MKT-4.A.4, MKT-4.A.5). You’ll need to show this on FRQs by shading CS and PS and identifying DWL (Skill 4.A). For a quick review and practice problems on this topic, see the Topic 2.6 study guide (https://library.fiveable.me/ap-microeconomics/unit-2/market-equilibrium-consumer-producer-surplus/study-guide/rT6VwtcikMj2QSanPBKu) and the unit practice set (https://library.fiveable.me/practice/ap-microeconomics).
How do I find the areas of consumer and producer surplus when given a table of data instead of a graph?
Find equilibrium first: the table will give quantity demanded and supplied at each price—equilibrium is the price where Qd = Qs (or where they cross). Then compute surplus by units traded (this is exactly what the CED expects: calculate areas from a graph or table—MKT-4.A). Treat the table as marginal values per unit: - Consumer surplus = sum over each unit sold of (buyer’s willingness to pay for that unit − equilibrium price). - Producer surplus = sum over each unit sold of (equilibrium price − seller’s marginal cost or minimum acceptable price for that unit). Example sketch: if at Pe you sell Qe = 3 units and the buyers’ willingness to pay for units 1–3 are $10, $9, $7, then CS = (10−Pe)+(9−Pe)+(7−Pe). If sellers’ marginal costs for those 3 units are $2, $4, $5, then PS = (Pe−2)+(Pe−4)+(Pe−5). Ignore negative terms (only count units actually traded). This is equivalent to summing triangular/rectangular areas on a graph. For more practice and examples, see the Topic 2.6 study guide (https://library.fiveable.me/ap-microeconomics/unit-2/market-equilibrium-consumer-producer-surplus/study-guide/rT6VwtcikMj2QSanPBKu) and thousands of practice problems (https://library.fiveable.me/practice/ap-microeconomics).
When supply and demand shift at the same time, how do you figure out what happens to equilibrium price and quantity?
Think of it as a two-step: (1) draw/identify the directions of the shifts; (2) use logic or algebra to find what’s definitely determined and what’s ambiguous. Quick rules: - If both curves shift the same direction (both right or both left) equilibrium quantity moves in that direction for sure; price is ambiguous (depends on shift magnitudes). - If curves shift in opposite directions (one right, one left), equilibrium price moves in the direction of the curve that shifts inward (e.g., demand up & supply down → price definitely rises); quantity is ambiguous. - To get a definite answer when something’s ambiguous, use algebra (new demand and supply equations) or draw accurate graphs to compare magnitudes and find the new intersection. On the AP exam you’ll often need a clear graph and explanation (CED Skill 4—draw/label shifts and show new equilibrium). For extra practice and examples, see the Topic 2.6 study guide (https://library.fiveable.me/ap-microeconomics/unit-2/market-equilibrium-consumer-producer-surplus/study-guide/rT6VwtcikMj2QSanPBKu) and try problems at (https://library.fiveable.me/practice/ap-microeconomics).
I keep mixing up consumer surplus and producer surplus on multiple choice questions - any tips to remember which is which?
Quick mnemonic: think “buyers pay less than they’d pay” and “producers get more than their cost.” - Consumer surplus = how much buyers were willing to pay (demand = marginal benefit) minus the market price. On a graph it’s the triangle above the price and under the demand curve. - Producer surplus = market price minus sellers’ cost (supply = marginal cost). On a graph it’s the triangle below the price and above the supply curve. So: CS = area above price, under demand; PS = area below price, above supply. At equilibrium (price where Qd = Qs) total surplus is maximized—a common AP point (CED MKT-4.A, MKT-4.A.4). For calculations use ½ × base × height for those triangular areas. If you want more practice reading those areas on graphs (MC + FRQ prep), check the Topic 2.6 study guide (https://library.fiveable.me/ap-microeconomics/unit-2/market-equilibrium-consumer-producer-surplus/study-guide/rT6VwtcikMj2QSanPBKu), the Unit 2 overview (https://library.fiveable.me/ap-microeconomics/unit-2), and lots of practice problems (https://library.fiveable.me/practice/ap-microeconomics).
What are some real world examples where markets don't reach equilibrium or aren't efficient?
Markets fail to reach equilibrium or aren’t efficient in lots of real-world cases. Examples tied to CED keywords: - Price ceilings (rent control): binding caps cause shortages, reduced consumer and producer surplus and deadweight loss. - Price floors (minimum wage or agricultural supports): create surpluses or unemployment and change surplus distribution. - Monopoly/market power: single sellers restrict quantity above competitive Q, raise price, shrink total economic surplus (deadweight loss). - Externalities (pollution): market supply ≠ marginal social cost, so too much is produced unless corrected (tax/subsidy). - Public goods and common resources: nonrival/nonexcludable goods (national defense, fisheries) lead to underprovision or overuse. - Information asymmetry (used cars, insurance): adverse selection/lemons reduce trades from equilibrium. For AP Micro, you should be able to show these on supply–demand graphs and identify changes in consumer/producer surplus and deadweight loss (Topic 2.6). Review examples and practice graph questions in the Topic 2.6 study guide (https://library.fiveable.me/ap-microeconomics/unit-2/market-equilibrium-consumer-producer-surplus/study-guide/rT6VwtcikMj2QSanPBKu) and more problems at (https://library.fiveable.me/practice/ap-microeconomics).
How does the supply-demand model help explain why prices are different in different markets?
The supply–demand model explains price differences across markets because each market has a different demand curve and supply curve, so they meet at different equilibrium prices and quantities. Demand shifts with tastes, income, prices of substitutes/complements, and elasticity; supply shifts with input costs, technology, number of sellers, and regulations. Where demand is higher (or supply is tighter), equilibrium price rises; where supply is abundant (or demand weak), price falls. Equilibrium price/quantity are the intersection that clears the market in a perfectly competitive setting, and that point maximizes total economic surplus (consumer + producer) absent market failures—which is why different curves → different surpluses and prices. For AP exam work you should be able to draw graphs, label equilibrium, and calculate consumer/producer surplus areas (Topic 2.6). Review the Topic 2.6 study guide (https://library.fiveable.me/ap-microeconomics/unit-2/market-equilibrium-consumer-producer-surplus/study-guide/rT6VwtcikMj2QSanPBKu), the Unit 2 overview (https://library.fiveable.me/ap-microeconomics/unit-2), and try practice problems (https://library.fiveable.me/practice/ap-microeconomics).
If equilibrium maximizes total surplus, why do governments sometimes intervene in markets?
Equilibrium maximizes total surplus only in a perfectly competitive market with no market failures. Governments intervene because real markets often fail that efficiency condition. Common reasons: externalities (pollution causes social costs > private costs), public goods (nonrival/nonexcludable goods won’t be supplied), market power (monopolies reduce quantity and raise price), asymmetric information (buyers or sellers lack info), and equity or redistribution goals (help low-income households). Interventions (taxes, subsidies, price floors/ceilings, regulation) can correct failures or shift surplus toward particular groups—but they can also create deadweight loss if poorly designed. On the AP exam you should be ready to show how interventions change consumer surplus, producer surplus, and deadweight loss on a supply–demand graph (Topic 2.6). For review and practice on these ideas, see the Topic 2.6 study guide (https://library.fiveable.me/ap-microeconomics/unit-2/market-equilibrium-consumer-producer-surplus/study-guide/rT6VwtcikMj2QSanPBKu) and Unit 2 resources (https://library.fiveable.me/ap-microeconomics/unit-2).