Interval Notation
4 min read•december 13, 2021
nick_guesto
nick_guesto
How to Write Interval Notation and What it Means
There are a few ways to talk about a range of values of possible solutions. In words, we can say something like "greater than 4 and less than 16" or "everything greater than or equal to 7". Instead of writing out those words, we can use different notations✏️
Infinity
We start talking about the concept of infinity a lot in upper-level math. We use the fancy symbol ∞ (on a Mac, "Option + 5"; on a PC, "Alt + 236") to represent the idea of not having a definite end.
Positive Infinity ()
On a graph, we represent positive infinity on the x-axis by the arrow continuing to the right, and on the y-axis by the arrow continuing upwards. Whenever we refer to "positive infinity" on a graph, it's either talking about "as the graph goes to the right" or "as the graph goes up." ☝️
Negative Infinity (–)
On a graph, we represent negative infinity on the x-axis by the arrow continuing to the left, and on the y-axis by the arrow continuing downwards. Whenever we refer to "negative infinity" on a graph, it's either talking about "as the graph goes to the left" or "as the graph goes down." 👇 -----
Parentheses ( ) vs. Brackets [ ]
In inequality notation, we have the difference between < and ≤. The line underneath represents the idea of < or =. We know that x < 5 does not include 5, but x ≤ 5 does include 5. Here's the quickest tip: x < 5 is the same as (-∞,5) and x ≤ 5 is the same as (-∞,5].
Parentheses ( ) are like < >, while brackets [ ] are like ≤ ≥.
Domain and Range
Let's look at the graph of y=√(x+5) or y=sqrt(x+5).
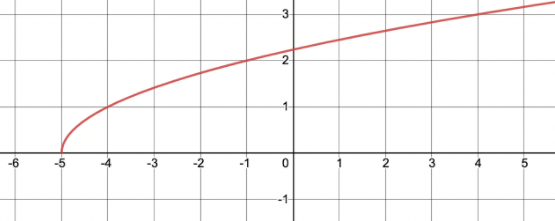
Graph from Desmos
For the domain (possible x-values), we know that we can plug in x = -4 and x = -5, but we can't plug in anything less than -5 because we'll end up with the square root of a negative, which isn't possible (until we get to imaginary numbers). So, the smallest x-value is -5 and the largest is…well, there isn't one. We can plug in x= 10, x= 250, or even x= 32,849,234, and we'll get a real output. So our domain would include all values greater than or equal to -5. In inequality notation, we'd write x ≥ -5, and in interval notation, we'd write [-5.∞).
For the range (possible y-values), we know that we'll end up with a positive number or zero, no negatives! So, the smallest y-value is 0 and the largest is...again, there isn't one! We can take the square root of a really large number and still get a really large number. So, in inequality notation, we'd write y ≥ 0, and in interval notation we'd write [0,∞).
Multiple Intervals
Sometimes there are multiple intervals that describe the graph or qualify as solutions. If we wanted to represent all values less than 5 AND all values greater than or equal to 19, as a compound inequality, we would write x < 5, x ≥ 19. In interval notation, we'd have (-∞,5) and we'd have [19,∞). We "join" these two intervals with a U to represent the "union," which leaves us with (-∞,5) U [19,∞).
Example Scenario
Let's suppose that 3 TAs are responsible for assigning feedback to students after an exam. Adam will work on exams that scored a 50 or lower, or greater than or equal to a 93. Beatriz will work on exams with scores greater than 50 but lower than 75. Chantal will work on the rest. (Note: The lowest possible score is 0 and the greatest is 100. It IS possible to score partial points.) We'll use subscripts to differentiate between the three domains.
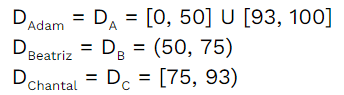
Notice that Adam receives the 50s while Beatriz does not, and so his 50 has the bracket ...50] and hers does not with (50… Also note that for Beatriz, the interval (50, 75) is written exactly the same as an ordered pair (50, 75). Because of this, it is super important to be clear if you're using parentheses or if you're referencing an interval or a point.
Practice Problems
Identify the domain and range using interval notation! All graphs are from Desmos.

Answers to Practice Problems
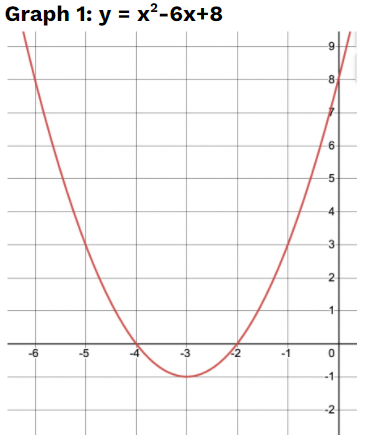
Graph 1: y = x^2-6x+8
Domain: (-∞,+∞) (or R or All Reals or All Real Numbers)
Range: [-1,∞)
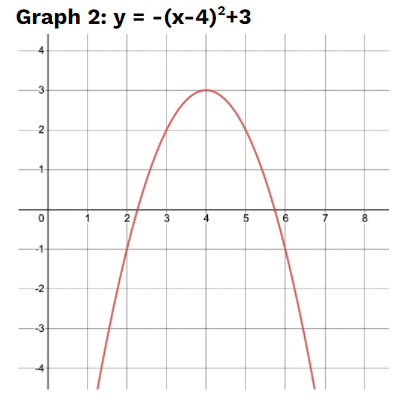
Graph 2: y = -(x-4)^2+3
Domain: (-∞,+∞) (or R or All Reals or All Real Numbers)
Range: (-∞,3]
Graph 3: y = -sqrt(x-2) + 4
Domain: [2,∞)
Range: (-∞,4]
Interval Notation
4 min read•december 13, 2021
nick_guesto
nick_guesto
How to Write Interval Notation and What it Means
There are a few ways to talk about a range of values of possible solutions. In words, we can say something like "greater than 4 and less than 16" or "everything greater than or equal to 7". Instead of writing out those words, we can use different notations✏️
Infinity
We start talking about the concept of infinity a lot in upper-level math. We use the fancy symbol ∞ (on a Mac, "Option + 5"; on a PC, "Alt + 236") to represent the idea of not having a definite end.
Positive Infinity ()
On a graph, we represent positive infinity on the x-axis by the arrow continuing to the right, and on the y-axis by the arrow continuing upwards. Whenever we refer to "positive infinity" on a graph, it's either talking about "as the graph goes to the right" or "as the graph goes up." ☝️
Negative Infinity (–)
On a graph, we represent negative infinity on the x-axis by the arrow continuing to the left, and on the y-axis by the arrow continuing downwards. Whenever we refer to "negative infinity" on a graph, it's either talking about "as the graph goes to the left" or "as the graph goes down." 👇 -----
Parentheses ( ) vs. Brackets [ ]
In inequality notation, we have the difference between < and ≤. The line underneath represents the idea of < or =. We know that x < 5 does not include 5, but x ≤ 5 does include 5. Here's the quickest tip: x < 5 is the same as (-∞,5) and x ≤ 5 is the same as (-∞,5].
Parentheses ( ) are like < >, while brackets [ ] are like ≤ ≥.
Domain and Range
Let's look at the graph of y=√(x+5) or y=sqrt(x+5).
Graph from Desmos
For the domain (possible x-values), we know that we can plug in x = -4 and x = -5, but we can't plug in anything less than -5 because we'll end up with the square root of a negative, which isn't possible (until we get to imaginary numbers). So, the smallest x-value is -5 and the largest is…well, there isn't one. We can plug in x= 10, x= 250, or even x= 32,849,234, and we'll get a real output. So our domain would include all values greater than or equal to -5. In inequality notation, we'd write x ≥ -5, and in interval notation, we'd write [-5.∞).
For the range (possible y-values), we know that we'll end up with a positive number or zero, no negatives! So, the smallest y-value is 0 and the largest is...again, there isn't one! We can take the square root of a really large number and still get a really large number. So, in inequality notation, we'd write y ≥ 0, and in interval notation we'd write [0,∞).
Multiple Intervals
Sometimes there are multiple intervals that describe the graph or qualify as solutions. If we wanted to represent all values less than 5 AND all values greater than or equal to 19, as a compound inequality, we would write x < 5, x ≥ 19. In interval notation, we'd have (-∞,5) and we'd have [19,∞). We "join" these two intervals with a U to represent the "union," which leaves us with (-∞,5) U [19,∞).
Example Scenario
Let's suppose that 3 TAs are responsible for assigning feedback to students after an exam. Adam will work on exams that scored a 50 or lower, or greater than or equal to a 93. Beatriz will work on exams with scores greater than 50 but lower than 75. Chantal will work on the rest. (Note: The lowest possible score is 0 and the greatest is 100. It IS possible to score partial points.) We'll use subscripts to differentiate between the three domains.
Notice that Adam receives the 50s while Beatriz does not, and so his 50 has the bracket ...50] and hers does not with (50… Also note that for Beatriz, the interval (50, 75) is written exactly the same as an ordered pair (50, 75). Because of this, it is super important to be clear if you're using parentheses or if you're referencing an interval or a point.
Practice Problems
Identify the domain and range using interval notation! All graphs are from Desmos.
Answers to Practice Problems
Graph 1: y = x^2-6x+8
Domain: (-∞,+∞) (or R or All Reals or All Real Numbers)
Range: [-1,∞)
Graph 2: y = -(x-4)^2+3
Domain: (-∞,+∞) (or R or All Reals or All Real Numbers)
Range: (-∞,3]
Graph 3: y = -sqrt(x-2) + 4
Domain: [2,∞)
Range: (-∞,4]
Resources
© 2024 Fiveable Inc. All rights reserved.
AP® and SAT® are trademarks registered by the College Board, which is not affiliated with, and does not endorse this website.