Analysis (PCA) is a powerful technique for reducing data complexity. It transforms high-dimensional datasets into lower-dimensional representations, preserving key information while simplifying analysis and visualization.

PCA finds patterns in data by identifying directions of maximum . This allows us to compress data, remove noise, and uncover hidden structures, making it a valuable tool in many fields like machine learning and data science.

PCA for Dimensionality Reduction

Fundamentals of Principal Component Analysis

Top images from around the web for Fundamentals of Principal Component Analysis
  • Principal Component Analysis (PCA) reduces high-dimensional data while preserving original variability
  • Transforms original variables into uncorrelated principal components through linear combinations
  • Identifies patterns in data highlighting similarities and differences
  • Visualizes high-dimensional data by projecting onto lower-dimensional space (typically 2 or 3 dimensions)
  • Applies to various fields (image processing, finance, bioinformatics, machine learning) for and noise reduction
  • Addresses curse of dimensionality by reducing features while retaining most information
  • Assumes directions with largest variance contain most important aspects of data structure

Applications and Benefits of PCA

  • Enables efficient data compression by representing data with fewer dimensions
  • Improves performance of machine learning algorithms by reducing overfitting
  • Facilitates data exploration and visualization of complex datasets
  • Enhances signal processing by separating signal from noise
  • Aids in feature selection by identifying most important variables
  • Supports anomaly detection by revealing unusual patterns in reduced space
  • Enables efficient data storage and transmission through

Applying PCA to Data Transformation

PCA Algorithm Steps

  • Center data by subtracting mean of each variable from corresponding values
  • Compute of centered data capturing relationships between variables
  • Perform on covariance matrix obtaining eigenvectors and eigenvalues
  • Sort eigenvectors in descending order of corresponding eigenvalues
  • Construct transformation matrix by selecting top k eigenvectors for desired reduced dimensions
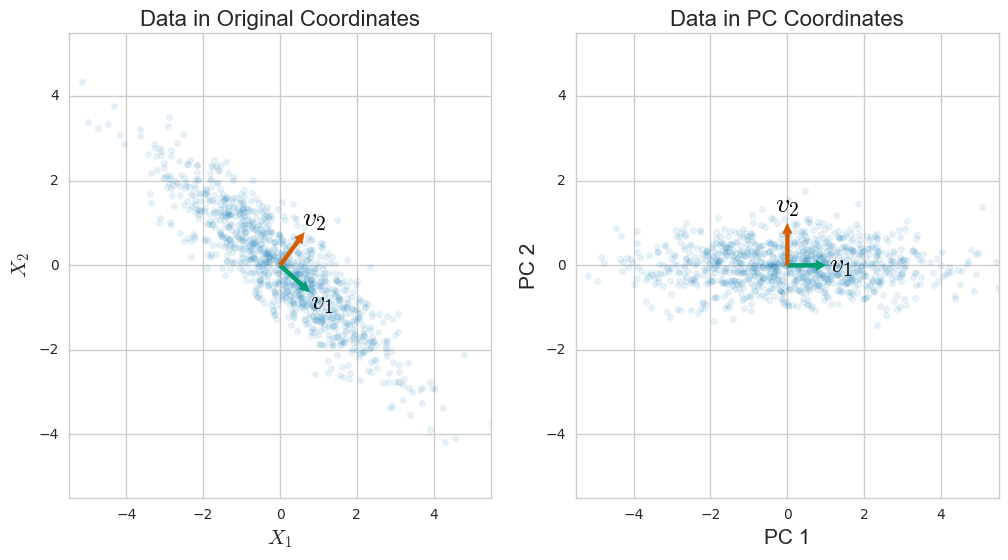
  • Project original data onto new lower-dimensional space by multiplying with transformation matrix

Mathematical Foundations of PCA

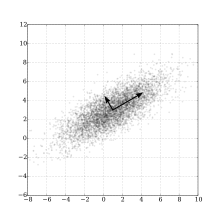
  • Eigenvectors represent directions of maximum variance in data
  • Eigenvalues indicate amount of variance explained by each eigenvector
  • PCA maximizes variance of projected data subject to orthogonality constraint
  • Covariance matrix C of centered data X calculated as C=1n1XTXC = \frac{1}{n-1}X^TX
  • Eigenvalue problem solved through equation Cv=λvC\mathbf{v} = \lambda\mathbf{v}
  • Transformation matrix W formed by concatenating selected eigenvectors
  • Reduced data Y obtained by matrix multiplication Y=XWY = XW

Interpreting Principal Components

Understanding Principal Component Significance

  • Each principal component represents direction of maximum data variance orthogonal to previous components
  • First principal component accounts for largest amount of variance with subsequent components explaining progressively less
  • of original variables on principal component indicate contribution to component
  • Proportion of variance explained by each component calculated by dividing eigenvalue by sum of all eigenvalues
  • graphs eigenvalues against component number to visually determine significant components
  • Cumulative proportion of variance explained determines components needed to retain desired percentage of original information
  • Biplots visualize observations and original variables in reduced space showing relationships and contributions to principal components

Analyzing Principal Component Composition

  • Examine magnitude and sign of loadings to interpret component meaning
  • Large positive loadings indicate strong positive correlation with component
  • Large negative loadings indicate strong negative correlation with component
  • Small loadings suggest minimal influence on component
  • Compare loadings across components to identify variables contributing to multiple dimensions
  • Analyze patterns in loadings to uncover underlying structures or latent factors in data
  • Consider domain knowledge when interpreting component meanings and significance

Evaluating PCA Effectiveness

Quantitative Measures of PCA Performance

  • Total variance explained by selected principal components measures information preservation
  • Reconstruction error quantifies information loss due to dimensionality reduction
  • Kaiser criterion retains components with eigenvalues greater than 1
  • Cross-validation assesses generalizability of PCA model to unseen data
  • Compare PCA results with alternative dimensionality reduction techniques (t-SNE, UMAP)
  • Measure computational efficiency and scalability for large datasets
  • Evaluate stability of principal components through bootstrapping or perturbation analysis

Considerations for PCA Application

  • Interpretability of principal components crucial for determining effectiveness in problem domain
  • Sensitivity to outliers may affect results in datasets with extreme values
  • Assumption of linearity limits effectiveness for strongly non-linear relationships
  • Scaling of input variables impacts PCA results consider or normalization
  • Balance between dimensionality reduction and information retention based on specific application needs
  • Assess impact of PCA on downstream tasks (classification, clustering) to gauge overall effectiveness
  • Consider domain-specific metrics or visualizations to evaluate PCA performance in context

Key Terms to Review (18)

Biplot: A biplot is a graphical representation that displays both the observations and variables of a dataset simultaneously, allowing for an intuitive understanding of the relationships between them. By plotting the scores of observations on one axis and the loadings of variables on another, a biplot provides insights into the underlying structure of the data, particularly in the context of dimension reduction techniques like PCA.
Covariance matrix: A covariance matrix is a square matrix that captures the pairwise covariances between multiple variables. It serves as a crucial tool in multivariate statistics, indicating how much two random variables vary together and helping to understand the relationships among them. In many analyses, particularly in dimensionality reduction techniques, the covariance matrix plays a key role in identifying the directions of maximum variance in data.
Cumulative variance: Cumulative variance refers to the total variance captured by a set of principal components in Principal Component Analysis (PCA). It helps in understanding how many principal components are needed to explain the variability in the data and assists in determining the optimal number of components for data reduction while retaining significant information.
Dimensionality Reduction: Dimensionality reduction is a process used to reduce the number of input variables in a dataset while preserving its essential characteristics. This technique helps in simplifying models, reducing computation costs, and minimizing overfitting by transforming high-dimensional data into a lower-dimensional space, which makes it easier to visualize and analyze.
Eigenvalue decomposition: Eigenvalue decomposition is a mathematical technique where a matrix is expressed in terms of its eigenvalues and eigenvectors. This process allows a square matrix to be factored into a set of eigenvalues that represent the scaling factors and eigenvectors that indicate the directions in which the transformations occur. It is crucial for understanding properties of matrices, particularly in solving linear systems and performing dimensionality reduction techniques.
Explained variance: Explained variance is a statistical measure that indicates how much of the total variability in a dataset is accounted for by a specific model or factor. It is crucial in understanding how well a model, such as those derived from Principal Component Analysis (PCA), captures the underlying structure of the data. By quantifying the proportion of variance explained by different components, it helps to identify the most significant dimensions of variability in a dataset.
Feature Extraction: Feature extraction is the process of transforming raw data into a set of measurable properties or features that can be used for analysis and modeling. This technique helps to reduce the dimensionality of data while preserving essential information, making it easier for algorithms to learn patterns and make predictions. By capturing relevant characteristics from the original dataset, feature extraction plays a crucial role in tasks such as classification, clustering, and regression.
Gene expression analysis: Gene expression analysis is the study of the patterns and levels of gene activity in a cell, tissue, or organism. This process involves measuring how much a gene is being expressed, which can indicate how genes respond to different conditions or treatments. Understanding gene expression is crucial for identifying genes that are linked to specific diseases, their functional roles, and how they interact within biological pathways.
Image Compression: Image compression is the process of reducing the size of an image file without compromising its quality to a significant extent. This technique is essential in managing data storage and speeding up transmission times across networks, particularly in applications like digital photography, web graphics, and video streaming.
Loadings: Loadings refer to the coefficients that indicate the relationship between the original variables and the principal components in Principal Component Analysis (PCA). They show how much each original variable contributes to a particular principal component, essentially reflecting the structure of the data and helping in the interpretation of the components. Loadings are crucial for understanding which variables are driving the variance captured by each component.
Principal component: A principal component is a linear combination of the original variables in a dataset that captures the maximum variance in the data. In other words, it transforms the original features into a new set of uncorrelated variables that prioritize the dimensions with the most information, facilitating dimensionality reduction while preserving as much variability as possible.
Python (scikit-learn): Scikit-learn is a powerful open-source machine learning library for Python that provides simple and efficient tools for data analysis and modeling. It supports a range of supervised and unsupervised learning algorithms, making it an essential resource for implementing techniques like Principal Component Analysis (PCA) to reduce dimensionality in datasets. Its user-friendly interface and extensive documentation help users efficiently apply various algorithms and visualize results, ensuring accessibility for both beginners and experienced practitioners.
R: In the context of Principal Component Analysis (PCA), 'r' typically represents the number of principal components retained after performing PCA on a dataset. This value is crucial as it determines how much of the original data's variance is preserved in the reduced representation, influencing the quality and interpretability of the results. Selecting the right 'r' helps in balancing between dimensionality reduction and retaining meaningful information from the dataset.
Scores: Scores are numerical representations of the position of data points in relation to the principal components derived from a dataset. In the context of dimensionality reduction techniques, scores allow for the visualization and interpretation of complex datasets by projecting them into a lower-dimensional space, preserving as much variance as possible.
Scree plot: A scree plot is a graphical representation that displays the eigenvalues of a dataset in descending order, typically used in the context of Principal Component Analysis (PCA). It helps in determining the optimal number of principal components to retain by illustrating the point at which the eigenvalues begin to level off, indicating diminishing returns in variance explained by additional components.
Singular Value Decomposition: Singular Value Decomposition (SVD) is a powerful mathematical technique used to factor a matrix into three distinct components, revealing its underlying structure. It decomposes a given matrix into the product of three matrices, where the central matrix contains singular values that represent the strength of various dimensions in the data. This method plays a crucial role in various applications such as dimensionality reduction, data compression, and noise reduction.
Standardization: Standardization is the process of transforming data to have a mean of zero and a standard deviation of one. This technique is essential in many statistical methods, as it helps to eliminate biases caused by varying scales or units in data. By scaling data to a common range, it enhances the performance of algorithms, ensuring that no single feature disproportionately influences the results.
Variance: Variance is a statistical measurement that describes the spread of data points in a dataset relative to their mean. It quantifies how much the values in a dataset differ from the average, providing insight into the level of dispersion or variability present. In contexts like regression and principal component analysis, understanding variance is crucial for assessing model performance and determining the significance of features.
© 2024 Fiveable Inc. All rights reserved.
AP® and SAT® are trademarks registered by the College Board, which is not affiliated with, and does not endorse this website.