Correlational studies in communication research explore relationships between variables without manipulation. They provide insights into naturally occurring patterns, helping researchers understand complex phenomena and generate hypotheses for future experimental work.
These studies examine various types of correlations, from positive to negative, and assess their strength. Key characteristics include naturalistic observation, non-manipulation of variables, and a focus on relationships. Researchers use correlation coefficients to quantify and interpret findings.
Definition of correlational studies
- Investigates relationships between variables without manipulating them, crucial for understanding complex communication phenomena
- Allows researchers to examine naturally occurring patterns and associations in communication behaviors and outcomes
- Provides a foundation for generating hypotheses and guiding future experimental research in communication studies
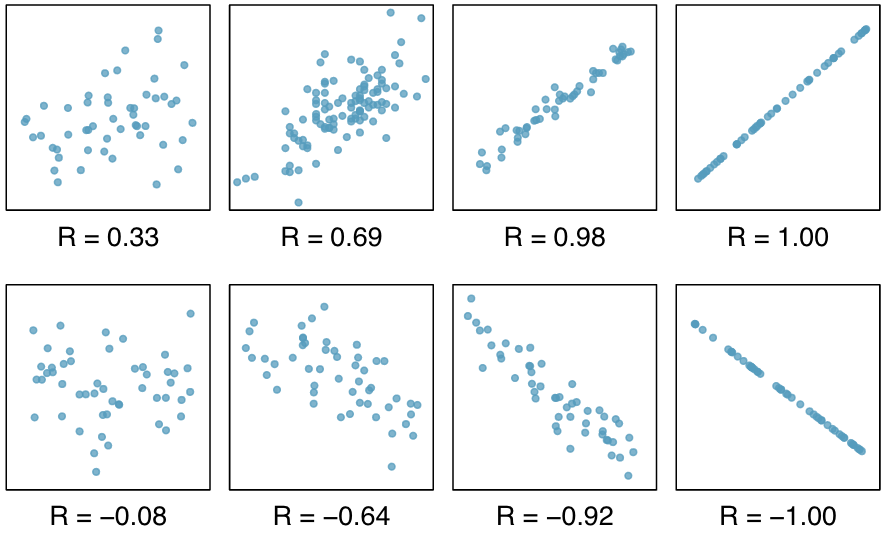
Types of correlations
- Positive correlation indicates variables increase or decrease together (more social media use correlates with higher anxiety levels)
- Negative correlation shows inverse relationship between variables (increased face-to-face communication correlates with decreased feelings of loneliness)
- Zero correlation suggests no linear relationship between variables (no association between hair color and public speaking ability)
- Curvilinear correlation reveals non-linear relationship (moderate levels of arousal correlate with optimal communication performance)
Strength vs direction
- Direction refers to positive or negative relationship between variables
- Strength indicates magnitude of relationship, ranging from -1 to +1
- Perfect positive correlation (+1) shows exact linear relationship (age and vocabulary size in children)
- Perfect negative correlation (-1) indicates inverse linear relationship (time spent on social media and academic performance)
- Weak correlations fall closer to 0, while strong correlations approach -1 or +1
- Moderate correlations typically range from ±0.3 to ±0.7 in communication research
Key characteristics
- Enables researchers to study complex communication phenomena in natural settings
- Provides insights into relationships between variables without artificial manipulation
- Forms basis for developing theories and models in communication research
Naturalistic observation
- Involves studying communication behaviors in real-world contexts
- Preserves ecological validity by examining phenomena as they naturally occur
- Allows for observation of spontaneous communication patterns (workplace interactions)
- Captures authentic behaviors that may be difficult to replicate in laboratory settings
Non-manipulation of variables
- Researchers do not control or alter variables under investigation
- Observes existing relationships without introducing experimental interventions
- Maintains the integrity of natural communication processes and dynamics
- Reduces potential for artificial influences on observed relationships
Relationship focus
- Emphasizes identifying and quantifying associations between variables
- Explores patterns and trends in communication-related factors
- Investigates how changes in one variable relate to changes in another
- Examines multiple variables simultaneously to understand complex interactions in communication processes
Correlation coefficient
- Quantifies the strength and direction of relationship between two variables
- Ranges from -1 to +1, with 0 indicating no linear relationship
- Crucial tool for interpreting and reporting correlational findings in communication research
Pearson's r
- Measures linear relationship between two continuous variables
- Assumes normal distribution and interval or ratio level data
- Calculated using the formula:
- Widely used in communication studies (correlation between media exposure and political attitudes)
Spearman's rho
- Assesses monotonic relationship between ordinal or ranked variables
- Does not require assumption of normal distribution
- Calculated by ranking data and applying formula:
- Useful for analyzing Likert scale data in communication surveys
Interpretation of values
- Strong positive correlation: 0.7 to 1.0 (high social media use and increased FOMO)
- Moderate positive correlation: 0.3 to 0.7 (public speaking experience and confidence)
- Weak positive correlation: 0.1 to 0.3 (news consumption and political knowledge)
- Correlations closer to 0 indicate weaker relationships
- Negative correlations interpreted similarly but in opposite direction
Advantages of correlational research
- Provides valuable insights into naturally occurring communication phenomena
- Allows for examination of complex relationships in real-world settings
- Serves as foundation for developing communication theories and models
Efficiency in data collection
- Enables researchers to gather large amounts of data quickly
- Utilizes existing datasets or readily available information
- Reduces need for complex experimental setups or interventions
- Allows for studying multiple variables simultaneously
Real-world applicability
- Examines communication processes in authentic contexts
- Enhances external validity of findings
- Provides insights directly relevant to practical communication situations
- Informs development of communication strategies and interventions
Hypothesis generation
- Identifies potential causal relationships for further investigation
- Guides development of experimental studies in communication research
- Reveals unexpected associations between communication variables
- Contributes to theory building and refinement in communication field
Limitations and challenges
- Requires careful interpretation to avoid overreaching conclusions
- Necessitates consideration of alternative explanations for observed relationships
- Demands rigorous methodological approaches to address inherent limitations
Causation vs correlation
- Correlation does not imply causation
- Cannot determine which variable causes changes in the other
- Requires additional research methods to establish causal relationships
- Necessitates caution in interpreting and reporting correlational findings
Third variable problem
- Unaccounted variables may influence observed relationships
- Spurious correlations can arise due to unmeasured factors
- Requires consideration of potential confounding variables
- Emphasizes importance of controlling for relevant factors in analysis
Restriction of range
- Limited variability in sample can attenuate observed correlations
- May underestimate true relationship strength in population
- Occurs when sample lacks representation of full range of variable values
- Requires careful sample selection and consideration of population characteristics
Statistical analysis techniques
- Provide tools for examining relationships between multiple variables
- Allow for more complex modeling of communication phenomena
- Enable researchers to control for confounding factors and isolate specific effects
Regression analysis
- Predicts values of dependent variable based on independent variables
- Simple linear regression examines relationship between two variables
- Multiple regression analyzes effects of multiple predictors simultaneously
- Hierarchical regression allows for stepwise inclusion of predictor variables
Factor analysis
- Identifies underlying latent variables or constructs
- Reduces large number of variables to smaller set of factors
- Exploratory factor analysis discovers underlying structure in data
- Confirmatory factor analysis tests hypothesized factor structures
Path analysis
- Examines direct and indirect relationships between variables
- Tests complex theoretical models in communication research
- Allows for simultaneous estimation of multiple regression equations
- Provides visual representation of relationships through path diagrams
Ethical considerations
- Ensure research adheres to ethical principles and guidelines
- Protect participants' rights and well-being throughout research process
- Maintain integrity and credibility of communication research findings
Informed consent
- Obtain voluntary agreement from participants to take part in study
- Provide clear information about research purpose and procedures
- Explain potential risks and benefits of participation
- Ensure participants understand their right to withdraw at any time
Privacy and confidentiality
- Protect participants' personal information and data
- Use anonymization or pseudonymization techniques when appropriate
- Securely store and manage research data
- Limit access to identifiable information to authorized personnel only
Potential for misinterpretation
- Clearly communicate limitations of correlational findings
- Avoid implying causation when only correlation is established
- Provide context and alternative explanations for observed relationships
- Educate stakeholders on proper interpretation of correlational results
Applications in communication research
- Demonstrates versatility of correlational studies across various subfields
- Highlights importance of understanding relationships between communication variables
- Illustrates how correlational research informs theory and practice in communication
Media effects studies
- Examines relationships between media exposure and attitudes or behaviors
- Investigates correlations between social media use and self-esteem
- Explores associations between violent media consumption and aggressive behavior
- Studies relationship between news framing and public opinion formation

Interpersonal communication
- Analyzes correlations between communication styles and relationship satisfaction
- Investigates associations between nonverbal cues and perceived trustworthiness
- Examines relationships between self-disclosure and intimacy in friendships
- Studies correlations between conflict resolution strategies and relationship longevity
Organizational communication
- Explores relationships between communication climate and employee job satisfaction
- Investigates correlations between leadership communication styles and team performance
- Examines associations between internal communication practices and organizational commitment
- Studies relationships between communication networks and innovation in organizations
Design considerations
- Ensure research design aligns with study objectives and research questions
- Maximize validity and reliability of correlational findings
- Address potential limitations and challenges in study design
Sample size and power
- Determine appropriate sample size to detect meaningful correlations
- Consider effect size, significance level, and desired power in calculations
- Use power analysis tools to estimate required sample size
- Balance practical constraints with statistical requirements
Variable selection
- Choose variables based on theoretical framework and research questions
- Consider potential confounding variables and control for them
- Ensure variables are measurable and operationally defined
- Select appropriate measurement scales (nominal, ordinal, interval, ratio)
Measurement reliability
- Assess consistency and stability of measurements
- Use established scales or develop reliable instruments
- Calculate reliability coefficients (Cronbach's alpha, test-retest reliability)
- Address potential sources of measurement error in study design
Reporting correlational results
- Present findings clearly and accurately to facilitate understanding
- Provide sufficient information for readers to interpret and evaluate results
- Adhere to established reporting standards in communication research
Statistical significance
- Report p-values to indicate probability of obtaining results by chance
- Use appropriate significance levels (typically p < .05 or p < .01)
- Interpret significance in context of sample size and effect size
- Avoid overreliance on significance as sole indicator of importance
Effect size
- Report measures of effect size alongside significance tests
- Use appropriate effect size measures (Cohen's d, r-squared, eta-squared)
- Interpret effect sizes in context of research domain and previous findings
- Discuss practical significance of observed effect sizes
Visualizing correlations
- Use scatterplots to display relationship between two variables
- Employ correlation matrices for multiple variable relationships
- Utilize heat maps to represent correlation strengths visually
- Incorporate regression lines or curves to illustrate trends in data
Future directions
- Explores emerging trends and opportunities in correlational research
- Addresses limitations of current approaches through innovative methods
- Anticipates future developments in communication research methodology
Integration with experimental methods
- Combines correlational and experimental designs for comprehensive understanding
- Uses correlational findings to inform experimental hypotheses and designs
- Employs quasi-experimental approaches to strengthen causal inferences
- Develops mixed-method studies to capitalize on strengths of both approaches
Big data and correlational studies
- Leverages large-scale datasets for more robust correlational analyses
- Applies machine learning techniques to identify complex patterns in data
- Explores correlations in real-time communication data streams
- Addresses challenges of data quality and representativeness in big data research
Longitudinal correlational research
- Examines relationships between variables over extended time periods
- Investigates developmental trajectories in communication processes
- Uses time-series analysis to explore temporal patterns in correlations
- Addresses challenges of participant retention and data collection in long-term studies